- Популярные видео
- Авто
- Видео-блоги
- ДТП, аварии
- Для маленьких
- Еда, напитки
- Животные
- Закон и право
- Знаменитости
- Игры
- Искусство
- Комедии
- Красота, мода
- Кулинария, рецепты
- Люди
- Мото
- Музыка
- Мультфильмы
- Наука, технологии
- Новости
- Образование
- Политика
- Праздники
- Приколы
- Природа
- Происшествия
- Путешествия
- Развлечения
- Ржач
- Семья
- Сериалы
- Спорт
- Стиль жизни
- ТВ передачи
- Танцы
- Технологии
- Товары
- Ужасы
- Фильмы
- Шоу-бизнес
- Юмор
Manipulating Charts and Graphs in Excel – Make Your Data Easier to Read
This video continues from Creating Charts and Graphs in Excel by showing how to refine and manipulate charts so your data is clearer and easier to interpret.
This video continues from Creating Charts and Graphs in Excel by showing how to refine and manipulate charts so your data is clearer and easier to interpret.
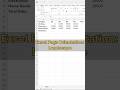
You’ll learn how to select entire charts and individual chart elements, adjust gridlines, add and format data labels and highlight specific values without cluttering the chart.
The video also covers working with pie charts, editing titles and legends, resizing and repositioning chart elements and using both the Design and Format tabs to customize colours and appearance.
The focus is on improving clarity and readability rather than visual effects.
Chapters
00:00 – Selecting charts and understanding Chart Tools
00:25 – Chart styles vs manual formatting
01:22 – Using Add Chart Element
01:39 – Showing and removing gridlines
03:23 – Adding and positioning data labels
05:03 – Selecting and formatting individual data points
06:52 – Manipulating pie charts and slices
08:33 – Adding titles, legends and labels
10:17 – Resizing text and chart elements
11:47 – Changing colors for emphasis
12:33 – Using the Format pane for precise control
14:19 – Different ways to format the same chart
📌 For more clear computer skills explained in plain English, subscribe to the channel.
———
Learn more at https://ProfessorTanaka.com
Видео Manipulating Charts and Graphs in Excel – Make Your Data Easier to Read канала Professor Tanaka
This video continues from Creating Charts and Graphs in Excel by showing how to refine and manipulate charts so your data is clearer and easier to interpret.
You’ll learn how to select entire charts and individual chart elements, adjust gridlines, add and format data labels and highlight specific values without cluttering the chart.
The video also covers working with pie charts, editing titles and legends, resizing and repositioning chart elements and using both the Design and Format tabs to customize colours and appearance.
The focus is on improving clarity and readability rather than visual effects.
Chapters
00:00 – Selecting charts and understanding Chart Tools
00:25 – Chart styles vs manual formatting
01:22 – Using Add Chart Element
01:39 – Showing and removing gridlines
03:23 – Adding and positioning data labels
05:03 – Selecting and formatting individual data points
06:52 – Manipulating pie charts and slices
08:33 – Adding titles, legends and labels
10:17 – Resizing text and chart elements
11:47 – Changing colors for emphasis
12:33 – Using the Format pane for precise control
14:19 – Different ways to format the same chart
📌 For more clear computer skills explained in plain English, subscribe to the channel.
———
Learn more at https://ProfessorTanaka.com
Видео Manipulating Charts and Graphs in Excel – Make Your Data Easier to Read канала Professor Tanaka
Excel charts and graphs Excel charts tutorial Excel graphs Excel graphs for beginners Excel pie chart Excel pie chart legend labels Excel pie chart design Excel pie chart move slice Move Excel chart to new tab Excel chart data range Charts in Excel tutorial Graphs in Excel sheet Pie chart in Excel with text Pie chart in Excel from one column How to create chart title in Excel How to make a graph in Excel Excel visualization
Комментарии отсутствуют
Информация о видео
2 ноября 2020 г. 18:46:50
00:14:32
Другие видео канала