- Популярные видео
- Авто
- Видео-блоги
- ДТП, аварии
- Для маленьких
- Еда, напитки
- Животные
- Закон и право
- Знаменитости
- Игры
- Искусство
- Комедии
- Красота, мода
- Кулинария, рецепты
- Люди
- Мото
- Музыка
- Мультфильмы
- Наука, технологии
- Новости
- Образование
- Политика
- Праздники
- Приколы
- Природа
- Происшествия
- Путешествия
- Развлечения
- Ржач
- Семья
- Сериалы
- Спорт
- Стиль жизни
- ТВ передачи
- Танцы
- Технологии
- Товары
- Ужасы
- Фильмы
- Шоу-бизнес
- Юмор
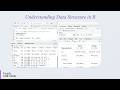
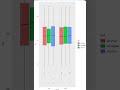
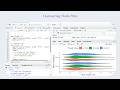
Categorical Variable by Group in R | Bar Chart Tutorial for Beginners
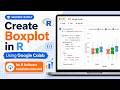
Bar Chart: Categorical Variable by Group
Learn biostatistics using R with real-world public health data.
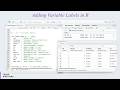
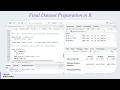
In this video, we cover practical data analysis in R, including data cleaning, visualization (ggplot2), and statistical modelling. This is designed for students, researchers, and public health professionals.
Topics covered:
- R programming for data analysis
- Biostatistics concepts
- Public health and epidemiology data
- Data visualization using ggplot2
- Regression and statistical models
Subscribe for more tutorials on R, biostatistics, and machine learning.
#Rprogramming #Biostatistics #PublicHealth #Epidemiology #DataAnalysis #ggplot2
Full course available on Udemy (link in description)
Видео Categorical Variable by Group in R | Bar Chart Tutorial for Beginners канала R and RStudio Data Analysis
Learn biostatistics using R with real-world public health data.
In this video, we cover practical data analysis in R, including data cleaning, visualization (ggplot2), and statistical modelling. This is designed for students, researchers, and public health professionals.
Topics covered:
- R programming for data analysis
- Biostatistics concepts
- Public health and epidemiology data
- Data visualization using ggplot2
- Regression and statistical models
Subscribe for more tutorials on R, biostatistics, and machine learning.
#Rprogramming #Biostatistics #PublicHealth #Epidemiology #DataAnalysis #ggplot2
Full course available on Udemy (link in description)
Видео Categorical Variable by Group in R | Bar Chart Tutorial for Beginners канала R and RStudio Data Analysis
Комментарии отсутствуют
Информация о видео
8 июня 2026 г. 12:00:06
00:03:35
Другие видео канала