Six Sigma | Never build a control chart this way! | Green Belt 2.0® Lean Six Sigma | fkiQuality HD
Avoid this common mistake: placing control limits at 3 standard deviations from the average.
Instead, control limits are calculated correctly from the variation within the sample or from one observation to the next. (x-mR and x-bar-R charts)
Based on a paper by Jean-Marie Gogue, French Deming Association.
Видео Six Sigma | Never build a control chart this way! | Green Belt 2.0® Lean Six Sigma | fkiQuality HD канала fkiQuality
Показать
Комментарии отсутствуют
Информация о видео
Другие видео канала
 Peru - Los Bancos de Oro
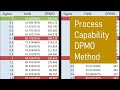 DPMO Method for Process Capability | Green Belt 2.0® Lean Six Sigma | fkiQuality HD
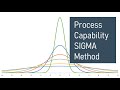 Sigma Method for Process Capability | Green Belt 2.0® Lean Six Sigma | fkiQuality HD
 Six Sigma | Real-world Effects of Low Quality | Green Belt 2.0® Lean Six Sigma | fkiQuality HD
 LEAN work is fast work | Green Belt 2.0® Lean Six Sigma | fkiQuality HD
 Six Sigma | The x-bar R Control Chart | Green Belt 2.0® Lean Six Sigma | fkiQuality HD
 Six Sigma | Mis-managing with Numbers | Green Belt 2.0® Lean Six Sigma | fkiQuality HD
 LEAN | The Kaizen Staircase | Green Belt 2.0® Lean Six Sigma | fkiQuality HD
 LEAN | 3 Nevers for a Perfect Process | Green Belt 2.0® Lean Six Sigma | fkiQuality HD
 Six Sigma | Project Management & Lean Six Sigma Go Together | Green Belt 2.0® | fkiQuality HD
 Green Belt workshop - Lean Six Sigma
 A Course Fit for All Organizations | Green Belt 2.0® Lean Six Sigma | fkiQuality HD
 See and Solve Problems Differently | Green Belt 2.0® Lean Six Sigma | fkiQuality HD
 Six Sigma | ZERO Defects 1: You don't want this | Green Belt 2.0® Lean Six Sigma | fkiQuality HD
 Six Sigma | Overview of the Control Chart | Green Belt 2.0® Lean Six Sigma | fkiQuality HD
 Six Sigma | Histograms can't show behavior | Green Belt 2.0® Lean Six Sigma | fkiQuality HD
 Six Sigma | The Price of Acting without Knowledge | Green Belt 2.0® Lean Six Sigma | fkiQuality HD
 ONE THING you are doing WRONG when Improving a Process | fkiQuality Lean Six Sigma Green Belt 2.0®
 Today is not Tomorrow | Green Belt 2.0® Lean Six Sigma | fkiQuality HD
 Six Sigma Overview | Fishbone Diagram | Green Belt 2.0® Lean Six Sigma | fkiQuality HD