Paula Moraga: Spatial modeling and interactive visualization with the R-INLA package
Lecturer: Paula Moraga. King Abdullah University of Science and Technology (KAUST)
Summary:
We will learn how to develop and interpret spatial models with R-INLA (http://www.r-inla.org), and how to create maps and other visualizations to facilitate the communication with collaborators and policymakers. The course is hands-on with three parts:
- Introduction to geospatial data and R-INLA
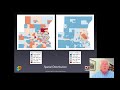
- Modeling areal data (lung cancer risk in Pennsylvania, USA)
- Modeling geostatistical data (malaria prevalence in The Gambia)
We will focus on health applications but the methods covered are applicable to many other fields that deal with georeferenced data such as ecology, demography or criminology
Slides: https://www.paulamoraga.com/presentation-geospatial/
Installing R packages:
install.packages(c("sp", "spdep", "raster", "rgdal", "rgeos", "ggplot2", "leaflet", "DT", "dplyr", "SpatialEpi", "geoR"))
install.packages("INLA", repos = "https://inla.r-inla-download.org/R/stable", dep = TRUE)
References
Moraga, P. Geospatial Health Data: Modeling and Visualization with R-INLA and Shiny. Chapman & Hall/CRC. ISBN 9780367357955 (2019). https://www.paulamoraga.com/book-geospatial/
How to cite this video:
http://doi.org/10.5446/49545
Видео Paula Moraga: Spatial modeling and interactive visualization with the R-INLA package канала Tomislav Hengl (OpenGeoHub Foundation)
Summary:
We will learn how to develop and interpret spatial models with R-INLA (http://www.r-inla.org), and how to create maps and other visualizations to facilitate the communication with collaborators and policymakers. The course is hands-on with three parts:
- Introduction to geospatial data and R-INLA
- Modeling areal data (lung cancer risk in Pennsylvania, USA)
- Modeling geostatistical data (malaria prevalence in The Gambia)
We will focus on health applications but the methods covered are applicable to many other fields that deal with georeferenced data such as ecology, demography or criminology
Slides: https://www.paulamoraga.com/presentation-geospatial/
Installing R packages:
install.packages(c("sp", "spdep", "raster", "rgdal", "rgeos", "ggplot2", "leaflet", "DT", "dplyr", "SpatialEpi", "geoR"))
install.packages("INLA", repos = "https://inla.r-inla-download.org/R/stable", dep = TRUE)
References
Moraga, P. Geospatial Health Data: Modeling and Visualization with R-INLA and Shiny. Chapman & Hall/CRC. ISBN 9780367357955 (2019). https://www.paulamoraga.com/book-geospatial/
How to cite this video:
http://doi.org/10.5446/49545
Видео Paula Moraga: Spatial modeling and interactive visualization with the R-INLA package канала Tomislav Hengl (OpenGeoHub Foundation)
Показать
Комментарии отсутствуют
Информация о видео
16 сентября 2020 г. 16:55:17
01:41:24
Другие видео канала
 Week 1a: What is spatial analysis? (Introduction to Spatial Data Science)
 The R-INLA project: Overview and recent developments
 Hengl, T. "Introduction to spatial and spatiotemporal data in R"
 Make Your Own Interactive Map of COVID-19 Spread Using R Shiny
 Jannes Münchow: "The importance of spatial cross-validation in predictive modeling"
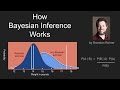 How Bayes Theorem works
 Alex Engler - Better DataViz in ggplot2: Tips, Tricks & Examples
 Geospatial risk models for tropical disease mapping
 You Know I’m All About that Bayes: Crash Course Statistics #24
 Bayesian Regression in R
 sdm: a reproducible and extensible R package for species distribution modelling
 UCGIS Workshop: Intro to Spatial Analysis with R
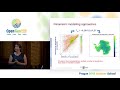 Hanna Meyer: "Machine-learning based modelling of spatial and spatio-temporal data"
 Data and it's types (Spatial data and attribute data) in GIS || Topic 2 || Full details
 Data Visualization in Map with STATA
 Uncommon Knowledge with Justice Antonin Scalia
 Bayesian Hierarchical Models
 Peter Diggle: Statistical Modelling Approaches to Disease Mapping
 Linear Regression in R, Step-by-Step
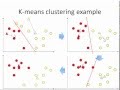 K-means clustering: how it works