Growth curve modeling using SPSS (Video 5 Orthogonal coding and modeling cross-level interactions)
This video reviews examples provided by Heck et al. (2014) in the context of growth curve modeling.
In particular, it demonstrates the use of orthogonal coding of time components and how to test for cross-level interactions by modeling L2 predictors of variation in the slope associated with the linear time component.
Data for these demonstrations can be downloaded here: https://drive.google.com/open?id=1NGZ8mFlZ939U92bVmHFCKQId5bBxSHoP
Видео Growth curve modeling using SPSS (Video 5 Orthogonal coding and modeling cross-level interactions) канала Mike Crowson
Показать
Комментарии отсутствуют
Информация о видео
Другие видео канала
 Determining number of factors: Exploratory factor analysis (EFA) using RStudio and EFA.dimensions
 Factorial ANOVA using IBM SPSS version 26 (2020)
 Avoiding error message when performing SEM in Stata by way of the nocapslatent and latent options
 Solving problem with Level 2 covariance type in SPSS (V26) when performing multilevel regression
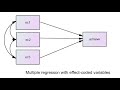 Multiple regression using SPSS with effect coded variables
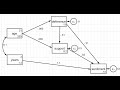 Path analysis with manifest variables using Stata Part 2: Direct, indirect, and total effects
 Dropping and subsetting variables from dataframes in R Studio (see links under video description!)
 Exploratory factor analysis using RStudio and EFA.dimensions package (video accompanying blog post)
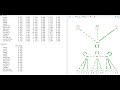 Testing full structural equation model using Lavaan (see linked text file under video description)
 Factorial ANOVA SPSS 29 (Jan 2023; see links in video description)
 Importing SPSS file with missing data into R Studio (see video description for linked data files)
 Determining number of factors during EFA using Maximum Likelihood factor analysis in SPSS
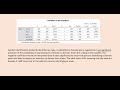 Getting more from binary logistic regression in SPSS (2019)
 Obtaining bootstrap CI's around goodness of fit measures when performing SEM using STATA (fun extra)
 Testing linearity in the logit using the Box-Tidwell transformation in SPSS (Part 2 of 2)
 Managing problem with Levene's test in SPSS version 25 ("unknown application error")
 Creating mean centered and compositional variables for multilevel analysis in RStudio
 Path analysis with latent variables in Stata based on 'sem' syntax
 Paired samples t-test using SPSS (May 2020)
 Computing sample covariance and Pearson's correlation (July, 2019)
 Generating multivariate normal variables using Daryanto's SPSS macro