- Популярные видео
- Авто
- Видео-блоги
- ДТП, аварии
- Для маленьких
- Еда, напитки
- Животные
- Закон и право
- Знаменитости
- Игры
- Искусство
- Комедии
- Красота, мода
- Кулинария, рецепты
- Люди
- Мото
- Музыка
- Мультфильмы
- Наука, технологии
- Новости
- Образование
- Политика
- Праздники
- Приколы
- Природа
- Происшествия
- Путешествия
- Развлечения
- Ржач
- Семья
- Сериалы
- Спорт
- Стиль жизни
- ТВ передачи
- Танцы
- Технологии
- Товары
- Ужасы
- Фильмы
- Шоу-бизнес
- Юмор
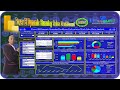
Power BI Show Cumulative Forecast and Actual on the Same Line: Tutorial DAX Method
Learn how to show cumulative Forecast and Actual values on the same line in Power BI in this step-by-step tutorial. This video explains how to combine forecasting, cumulative totals, and actual data into a single visual for better trend analysis and reporting using “Data Analysis Expressions” DAX Method
Whether you’re a beginner learning Power BI or an advanced user working with DAX measures, this tutorial will help you build clearer and more insightful reports.
📌 What you’ll learn in this video:
• How to create cumulative Actual values in Power BI
• How to display Forecast and Actual together on the same line chart
• Best practices for forecasting visuals in Power BI
• Tips for cleaner and more effective Power BI dashboards
• Cumulative Predictive Precision using DAX Code
• Applying CAGR Formula to calculate the average annual growth rate
🔔 Don’t forget to like, share, and subscribe for more Power BI tutorials and DAX tips.
Related Video Tutorial!
Star Rating Visuals in Power BI Dashboard: https://www.youtube.com/watch?v=N2rK-X4H3hM
New Card Visual Tutorial in Power BI September 2024: https://www.youtube.com/watch?v=lo_PztVuh5k
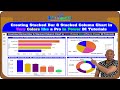
How to create Stacked Bar & Stacked Column Chart in Vary Colors like a Pro in Power BI Tutorials: https://www.youtube.com/watch?v=FQwaHa6bFvg
Creating Dynamic Power BI Dashboards: Show Images on Button Clicks: https://www.youtube.com/watch?v=GGxu83r0V_8
Power BI Sales Dashboard: How to Create a Dynamic & Stunning Sales Report Tutorial: https://www.youtube.com/watch?v=MDUShliB8bk
Power BI Tutorial How To Create Multiple Tables Relationship: https://www.youtube.com/watch?v=AlmfsXghw_A
Power BI Connect Excel in OneDrive Personal to Power BI | Step-by-Step Guide: https://www.youtube.com/watch?v=w2Wg2yj94ak
How to Display Last Refresh Date & Time in Power BI | Step-by-Step Tutorial: https://www.youtube.com/watch?v=jnQCiO4Sulk
Power BI Greeting Based on Time of Day (DAX Trick): https://www.youtube.com/watch?v=u8ANyYAF1oo
Power BI Tricks Build Reports from Huge Excel Files (No Row Limit!): #https://www.youtube.com/watch?v=g0tyXNMGy70#
Power BI Tricks: Build Reports from Huge Excel Files (No Row Limit!) VBA Automated Process: #https://www.youtube.com/watch?v=https://img.youtube.com/vi/PbLhjci2yYs/maxresdefault.jpg#
Create Dynamic Chart Colors in Power BI Using DAX (Beginners to Advanced Tutorial): #https://www.youtube.com/watch?v=ShstfCr8gk0#
Power BI Made Easy: Dynamic Parameter Table Fields in Report View: #https://www.youtube.com/watch?v=Q9xcyZKNvik#
Power BI Show Cumulative Forecast and Actual on the Same Line: Tutorial Visual Method: #https://www.youtube.com/watch?v=h-MiGM6NTb8#
Видео Power BI Show Cumulative Forecast and Actual on the Same Line: Tutorial DAX Method канала Data Solver
Whether you’re a beginner learning Power BI or an advanced user working with DAX measures, this tutorial will help you build clearer and more insightful reports.
📌 What you’ll learn in this video:
• How to create cumulative Actual values in Power BI
• How to display Forecast and Actual together on the same line chart
• Best practices for forecasting visuals in Power BI
• Tips for cleaner and more effective Power BI dashboards
• Cumulative Predictive Precision using DAX Code
• Applying CAGR Formula to calculate the average annual growth rate
🔔 Don’t forget to like, share, and subscribe for more Power BI tutorials and DAX tips.
Related Video Tutorial!
Star Rating Visuals in Power BI Dashboard: https://www.youtube.com/watch?v=N2rK-X4H3hM
New Card Visual Tutorial in Power BI September 2024: https://www.youtube.com/watch?v=lo_PztVuh5k
How to create Stacked Bar & Stacked Column Chart in Vary Colors like a Pro in Power BI Tutorials: https://www.youtube.com/watch?v=FQwaHa6bFvg
Creating Dynamic Power BI Dashboards: Show Images on Button Clicks: https://www.youtube.com/watch?v=GGxu83r0V_8
Power BI Sales Dashboard: How to Create a Dynamic & Stunning Sales Report Tutorial: https://www.youtube.com/watch?v=MDUShliB8bk
Power BI Tutorial How To Create Multiple Tables Relationship: https://www.youtube.com/watch?v=AlmfsXghw_A
Power BI Connect Excel in OneDrive Personal to Power BI | Step-by-Step Guide: https://www.youtube.com/watch?v=w2Wg2yj94ak
How to Display Last Refresh Date & Time in Power BI | Step-by-Step Tutorial: https://www.youtube.com/watch?v=jnQCiO4Sulk
Power BI Greeting Based on Time of Day (DAX Trick): https://www.youtube.com/watch?v=u8ANyYAF1oo
Power BI Tricks Build Reports from Huge Excel Files (No Row Limit!): #https://www.youtube.com/watch?v=g0tyXNMGy70#
Power BI Tricks: Build Reports from Huge Excel Files (No Row Limit!) VBA Automated Process: #https://www.youtube.com/watch?v=https://img.youtube.com/vi/PbLhjci2yYs/maxresdefault.jpg#
Create Dynamic Chart Colors in Power BI Using DAX (Beginners to Advanced Tutorial): #https://www.youtube.com/watch?v=ShstfCr8gk0#
Power BI Made Easy: Dynamic Parameter Table Fields in Report View: #https://www.youtube.com/watch?v=Q9xcyZKNvik#
Power BI Show Cumulative Forecast and Actual on the Same Line: Tutorial Visual Method: #https://www.youtube.com/watch?v=h-MiGM6NTb8#
Видео Power BI Show Cumulative Forecast and Actual on the Same Line: Tutorial DAX Method канала Data Solver
Power BI Power BI tutorial Power BI forecasting forecast vs actual Power BI cumulative forecast Power BI line chart Power BI DAX cumulative total Power BI Power BI visualization Power BI dashboard business intelligence data analytics data visualization Power BI Power BI dynamic visuals Power BI trend analysis analytics dashboard Power BI advanced tips Power BI beginners Taiwo Kujore Leila Gharani Kevin Stratvert CAGR Compound Annual Growth Rate
Комментарии отсутствуют
Информация о видео
4 января 2026 г. 19:00:50
00:10:01
Другие видео канала