- Популярные видео
- Авто
- Видео-блоги
- ДТП, аварии
- Для маленьких
- Еда, напитки
- Животные
- Закон и право
- Знаменитости
- Игры
- Искусство
- Комедии
- Красота, мода
- Кулинария, рецепты
- Люди
- Мото
- Музыка
- Мультфильмы
- Наука, технологии
- Новости
- Образование
- Политика
- Праздники
- Приколы
- Природа
- Происшествия
- Путешествия
- Развлечения
- Ржач
- Семья
- Сериалы
- Спорт
- Стиль жизни
- ТВ передачи
- Танцы
- Технологии
- Товары
- Ужасы
- Фильмы
- Шоу-бизнес
- Юмор
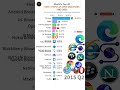
Safe Drinking Water Access by Country: Population & Share (2000–2024)
👀 Watch, How many people have access to safe drinking water, and which countries achieved the highest coverage by 2024?
This video explores safe drinking water access by country from 2000 to 2024, showing both the number of people with access and the share of the population with safe drinking water through monthly estimates.
From highly populated countries such as India, China, the United States, Indonesia, Brazil, and Pakistan to smaller nations with near-universal coverage, this visualization highlights global progress toward safe and reliable drinking water.
Discover where billions gained access to safer water, which countries achieved the highest coverage rates, and how access to safe drinking water evolved over the last two decades.
📊 IN THIS VIDEO, You'll discover:
✅ People with access to safe drinking water
✅ Population share with safe drinking water access
✅ Monthly country rankings
✅ Global progress since 2000
✅ Countries with the largest improvements
✅ Safe water coverage trends over time
✅ Progress toward universal water access
📈 Data Unit: People & Population Share (%)
🗓️ Coverage: 2000 – 2024 (monthly)
📚 Sources: WHO, UNICEF, World Bank
👥 PERFECT FOR: Students, researchers, policymakers, environmental enthusiasts, and anyone interested in public health, sustainable development, clean water, and global living standards.
🏆 LARGEST SAFE WATER COUNTRIES:
India
China
United States
Indonesia
Brazil
Pakistan
Nigeria
Bangladesh
Russia
Mexico
💬 Have questions or thoughts? Share them in the comments below — respectful discussions are always welcome.
😊 I hope you enjoyed this video and found it informative. Thank you for your valuable time and support! 🙏
Your support makes a big difference.
✅ Don’t forget to LIKE, SHARE, and SUBSCRIBE for more insightful content!
📝 Notes:
1. Monthly values are interpolated from annual estimates for visualization purposes.
2. Safe drinking water refers to safely managed drinking water services as defined by the WHO/UNICEF Joint Monitoring Programme (JMP).
3. The video includes both the number of people with access and the percentage share of the population with access.
4. Some countries may appear or disappear depending on data availability.
5. Figures may vary slightly across different sources and reporting methodologies.
6. Includes UN member states, observer states, and partially recognized sovereign states/countries only
7. All figures presented are approximate estimates derived from publicly available data sources. While every effort has been made to ensure accuracy, some uncertainty may remain.
#SafeDrinkingWater #CleanWater #WaterAccess #DrinkingWater #SDG6 #PublicHealth #WorldPopulation #DataVisualization #Statistics #Top10
Видео Safe Drinking Water Access by Country: Population & Share (2000–2024) канала Data With Beauty
safe drinking water access by country population with safe drinking water safe drinking water coverage drinking water access by country safely managed drinking water clean water access water access percentage water coverage by country drinking water statistics clean water global water access trends drinking water ranking water accessibility statistics
Комментарии отсутствуют
Информация о видео
15 ч. 60 мин. назад
00:05:13
Другие видео канала