- Популярные видео
- Авто
- Видео-блоги
- ДТП, аварии
- Для маленьких
- Еда, напитки
- Животные
- Закон и право
- Знаменитости
- Игры
- Искусство
- Комедии
- Красота, мода
- Кулинария, рецепты
- Люди
- Мото
- Музыка
- Мультфильмы
- Наука, технологии
- Новости
- Образование
- Политика
- Праздники
- Приколы
- Природа
- Происшествия
- Путешествия
- Развлечения
- Ржач
- Семья
- Сериалы
- Спорт
- Стиль жизни
- ТВ передачи
- Танцы
- Технологии
- Товары
- Ужасы
- Фильмы
- Шоу-бизнес
- Юмор
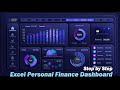
Excel Data Manipulator Bar Chart for Interactive Dashboard Design
Ever wished you could literally squeeze performance out of your data like juice from a lemon? 🍋
Dashboard Template: https://exceltable.com/en/templates/free-download-5-business-dashboard-templates
Meet the Excel Data Manipulator Bar Chart - a visual tool so powerful and intuitive that every project manager secretly dreams of having it on their dashboard.
This is not your typical Excel bar chart. This is a data command center, a KPI extractor, and a project manager’s dream come true — all wrapped in a sleek, interactive dashboard. With just a few clicks, you can visualize progress, compare team efficiency, and predict how close you are to your monthly targets before the numbers even settle.
Get ready to turn raw data into smart decisions — because this chart doesn’t just display information; it manipulates it to show what truly matters.
✅ Easily control data filters directly from your chart
✅ Instantly visualize performance changes and team results
✅ Automate insights for faster KPI interpretation
✅ Build stunning dashboards that look like advanced BI tools — all in Excel
Whether you manage sales, operations, or creative projects, this interactive bar chart gives you the visual power and control you’ve always wanted. It’s analytics with attitude — intelligent, precise, and just a bit sarcastic about spreadsheets that don’t deliver.
Because let’s be honest — Excel is amazing, but it gets even better when your chart can think like a manager.
💡 Try it yourself and see why this Bar Chart Manipulator is becoming a favorite among professionals who want their dashboards to do more than just “look good.”
#ExcelDashboard #DataVisualization #ExcelTips #DataManipulator
Видео Excel Data Manipulator Bar Chart for Interactive Dashboard Design канала Excel Visual
excel visual Excel data manipulator How to create interactive bar chart in Excel Excel dashboard design with dynamic charts KPI tracker bar chart in Excel Excel automation for project managers Data visualization tricks in Excel Advanced Excel dashboard templates Interactive business analytics in Excel Excel chart that filters and controls data
Комментарии отсутствуют
Информация о видео
21 октября 2025 г. 18:36:51
00:01:41
Другие видео канала