Trailing Stoploss & Locking Profits using Heikin Ashi Candles
Learn everything about the #niftyfuture #nifty . #SpeakingTechnically is a Knowledge Show on the ProRSI YouTube Channel. Speaking Technically we aim to break the myths of Trading using Technical analysis and Training in the financial markets and provide true Knowledge to people which Trading Gurus have been hiding till now. Started By Bharat Jhunjhunwala. He is an International Certified Technical Analyst and a successful trader. He has trained more than 5000 people all over the world. He has written many articles/blogs over a period of time which has been appreciated for its content and TRUTH. Bharat is a CMT, CFTe, and MSTA. He has been awarded MFTA from the prestigious IFTA (USA), for his works on RSI. He has been closely involved in trading stock and commodities since 2006.
** Facebook : https://www.facebook.com/bharat.jhunj...
** Twitter: https://twitter.com/BharatJ82
** LinkedIn: https://www.linkedin.com/in/bharatmft...
** Website: https://www.prorsi.com
** Email: infoatprorsi@gmail.com
BACKGROUND MUSIC:
Modern Business and Uplifting Corporate
Music License
Purchase code: b11647e9-7234-4a06-9c8d-8509cfb89a69
Corporate and Business Innovation
Music License
Purchase code: 5ae3ca50-4b86-44e0-b2d0-01134d3b0abd
Uplifting Inspirational and Upbeat Motivational Corporate
Music License
Purchase code: 3e8c73dc-2de1-463e-b4da-d276fbd9ec5d
Heikin Ashi is a type of trading chart that originated in Japan, and it's similar to candlestick charts in that the color of the candlestick denotes the direction the price is moving.
The main difference between traditional candlestick charts and Heikin Ashi (HA) charts is that HA charts the average price moves, creating a smoother appearance. Because the HA price bars are averaged, they don't show the exact open and close prices for a particular time period.
Some traders want additional confirmation of trend direction, and Heikin Ashi charts are often used as a technical indicator on a typical candlestick chart, to help highlight and clarify the current trend.
Heikin Ashi charts are sometimes used on their own, especially by swing traders or investors. Day traders tend to use Heikin Ashi charts more as an indicator, as HA charts have certain other benefits.
The Heikin Ashi Calculation
Heikin Ashi charts smooth price activity by calculating average values. An HA chart calculates its own open (HAO), high (HAH), low (HAL) and close (HAC) using the actual open (O), high (H), low (L) and close (C) of the time frame (1 minute, 5 minute, 15 minute, etc.).
Calculation:
HAO = (Open of previous bar + Close of previous bar) / 2
HAC = (Open + High + Low + Close) / 4
HAH = Highest of High, Open, or Close
HAL = Lowest of Low, Open, or Close
A mathematical formula is used for calculating each price bar on a Heikin Ashi chart. Because of this, you don't know the exact price at which a given time period opened or closed. When day trading, this can be an issue, since knowing the exact price, especially when you're trading off a chart, is important. For longer-term traders, this is less of an issue since the open and close of a price bar is not as important in trades that last weeks, months or years.
Advantages of Heikin Ashi
While Heikin Ashi won't show the exact price all the time, there are benefits to using Heikin Ashi charts. The main advantage is that the charts are much "smoother" looking, which helps to more easily identify the trending direction. Heikin Ashi Charts are also color-coded, like candlesticks, so as long as the price is rising (based on the calculations) then the bars will show up as green (or another color of your choosing). As long as the price is falling (based on the calculation) then the bars will show up as red (or another color of your choosing).
As an example, the attached chart shows the S&P 500 SPDR (SPY) ETF over the time frame using Heikin Ashi and candlesticks.
While candlestick charts may flip-flop constantly from a green bar to a red bar to a green bar, Heikin Ashi charts tend to have longer stretches of green and red bars, which provides more clear highlighting and confirmation of current trends.
Using the HA Charts
Heikin Ashi charts can be used in the same fashion as any other chart, for finding chart patterns like triangles and wedges, or trade setups. Entry and exit points may vary slightly compared to using a candlestick chart, since the price on an HA chart may be slightly different than on the candlestick chart.
Test your strategies first to see if they work well on Heikin Ashi charts, before opting to use them when real money is on the line.
Final World on Trading With Heikin Ashi Charts
One chart type isn't necessarily better than another. Rather, some traders like Heikin Ashi charts because they help isolate the trend better and aren't as choppy to look at, while other traders like the additional detail and precise pricing of standard candlestick or bar charts.
Видео Trailing Stoploss & Locking Profits using Heikin Ashi Candles канала Bharat Jhunjhunwala
Показать
Комментарии отсутствуют
Информация о видео
Другие видео канала
 Heiken Ashi using for catching BIG moves Intraday. Best Option Scalping Strategy.
 How To Read Price Action Using Heikin-Ashi Charts (Heikin Ashi Candles Explained For Beginners)
 Using Heikin Ashi with Dual Stochastics _ Advanced Trading Methodology
 Heikin Ashi Scalping Strategy
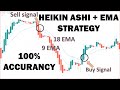 HEIKIN ASHI + EMA TRADING STRATEGY - 100% WIN RATE
 HOW TO BECOME A FULL TIME TRADER IN JUST TWO DAYS!!!
 HOW TO TRADE With Heiken Ashi Candlesticks (Heiken Ashi Trading Strategy) - Part 3 🔥🔥
 Heikin Ashi Secrets: Best Heikin Ashi Trading Strategy (Powerful)
 Master The ATR Indicator (Most Useful Indicator On The PLANET!)
 5 Rules of Heiken Ashi Candlesticks - Price Action Strategy (HINDI)
 Taking Partial Profits in ByBit Tutorial | Managing Open Trades
 FAILED Candlesticks| Generating PROFITS using FAILED Patterns| Momentum Trading
 Nifty's Affair with 17400 Levels| BankNifty & 200 DMA| Stocks & Cryptos
 Multi Timeframe Analysis using RSI to find HIGH Probability Trade Setup
 🔴 EMA-Heiken Ashi | This is The Trading Strategy The Top 5% Use (and it makes trading way too EASY!)
 Making money, Trading Heikin Ashi Candles to reach your Profit Goals!
 Smoothed EMA Heiken Ashi Strategies For Day Trading & Swing Trading (For Beginners)
 Using Super Trend to trade intraday & position in stocks, commodities & forex
 The Only "HEIKIN ASHI" Day Trading Strategy You Will Ever Need (Complete Tutorial)