- Популярные видео
- Авто
- Видео-блоги
- ДТП, аварии
- Для маленьких
- Еда, напитки
- Животные
- Закон и право
- Знаменитости
- Игры
- Искусство
- Комедии
- Красота, мода
- Кулинария, рецепты
- Люди
- Мото
- Музыка
- Мультфильмы
- Наука, технологии
- Новости
- Образование
- Политика
- Праздники
- Приколы
- Природа
- Происшествия
- Путешествия
- Развлечения
- Ржач
- Семья
- Сериалы
- Спорт
- Стиль жизни
- ТВ передачи
- Танцы
- Технологии
- Товары
- Ужасы
- Фильмы
- Шоу-бизнес
- Юмор
Kubernetes Centralized Logging with Grafana, Loki & Promtail | Real DevOps Project
🚀 Kubernetes Centralized Logging Project | Grafana + Loki + Promtail
In this video, I build a complete centralized logging stack on Kubernetes using Grafana, Loki, and Promtail.
This project demonstrates how logs from Kubernetes workloads can be collected, aggregated, and visualized through Grafana dashboards, which is a common production-grade observability pattern used in modern DevOps environments.
What I Built
✅ K3d Kubernetes Cluster
✅ NGINX Sample Application
✅ Loki Log Aggregation System
✅ Promtail Log Collection Agent
✅ Grafana Visualization Dashboard
✅ Kubernetes Services & Ingress Configuration
✅ Kustomize-Based Project Structure
✅ Monitoring Namespace Isolation
Technologies Used
Kubernetes
K3d
Grafana
Loki
Promtail
NGINX
Kustomize
Linux
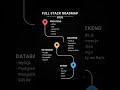
Project Structure
base/
├── grafana/
├── loki/
├── promtail/
├── nginx/
├── kustomization.yaml
└── namespace.yaml
Key DevOps Concepts Covered
Centralized Logging
Kubernetes Observability
Log Aggregation
DaemonSets
ConfigMaps
Services
Ingress
Namespace Management
Infrastructure as Code
📌 This project is part of my DevOps learning and portfolio journey where I build real-world projects and document the complete implementation.
If you found this useful, don't forget to Like, Share, and Subscribe.
#DevOps #Kubernetes #Grafana #Loki #Promtail #Observability #CloudComputing #SRE #K3d #NGINX #Monitoring #PlatformEngineering #VijayDabkara
Видео Kubernetes Centralized Logging with Grafana, Loki & Promtail | Real DevOps Project канала Vijay Dabkara
In this video, I build a complete centralized logging stack on Kubernetes using Grafana, Loki, and Promtail.
This project demonstrates how logs from Kubernetes workloads can be collected, aggregated, and visualized through Grafana dashboards, which is a common production-grade observability pattern used in modern DevOps environments.
What I Built
✅ K3d Kubernetes Cluster
✅ NGINX Sample Application
✅ Loki Log Aggregation System
✅ Promtail Log Collection Agent
✅ Grafana Visualization Dashboard
✅ Kubernetes Services & Ingress Configuration
✅ Kustomize-Based Project Structure
✅ Monitoring Namespace Isolation
Technologies Used
Kubernetes
K3d
Grafana
Loki
Promtail
NGINX
Kustomize
Linux
Project Structure
base/
├── grafana/
├── loki/
├── promtail/
├── nginx/
├── kustomization.yaml
└── namespace.yaml
Key DevOps Concepts Covered
Centralized Logging
Kubernetes Observability
Log Aggregation
DaemonSets
ConfigMaps
Services
Ingress
Namespace Management
Infrastructure as Code
📌 This project is part of my DevOps learning and portfolio journey where I build real-world projects and document the complete implementation.
If you found this useful, don't forget to Like, Share, and Subscribe.
#DevOps #Kubernetes #Grafana #Loki #Promtail #Observability #CloudComputing #SRE #K3d #NGINX #Monitoring #PlatformEngineering #VijayDabkara
Видео Kubernetes Centralized Logging with Grafana, Loki & Promtail | Real DevOps Project канала Vijay Dabkara
loki tutorial grafana tutorial promtail tutorial prometheus tutorial monitoring tutorial observability tutorial kubernetes tutorial devops tutorial grafana stack for monitoring and observability nginx tutorial cluster create by k3d deployment create by kubernetes port mapping through service and ingress monitoring and observability tools and technologies
Комментарии отсутствуют
Информация о видео
14 июня 2026 г. 19:07:28
00:00:20
Другие видео канала