Getting the best results from your ML models | Youden's Index
In this video, we dive into Youden's Index, a valuable metric in classification problems. But first, let's discuss the basic concept of classification, where a class is predicted by comparing the predicted probabilities with a threshold, typically set at 0.5 in many sklearn algorithms. 📊
Pre-requisite videos:
Confusion Matrix - https://youtu.be/b83gwi7IyK4
ROC Curve - https://youtu.be/ExJCi6aj1cM
Imagine a scenario where we have a binary classification problem. On the ROC curve, we have the True Positive Rate (TPR) on the y-axis and the False Positive Rate (FPR) on the x-axis. By varying the threshold, we can plot different points on this curve, each representing a different trade-off between TPR and FPR. 🔄
Now, let's consider the extreme cases. When the model is perfect i.e. FP and FN both are zeros, our model is perfectly accurate and Youden's index is +1. Conversely, when the TP and TN both are zeros, our model is perfectly erratic. These extremes help us understand the behavior of the J statistic. 📈
Maximizing the J statistic helps us find the optimal threshold. This can be visualized as the height of the difference between the threshold and the line of the random classifier on the ROC curve. By finding this optimal threshold, we can improve the performance of our classification model. 🔝
Join us in this video as we uncover the intricacies of Youden's Index and its role in enhancing the effectiveness of classification models. Don't forget to like, share, and subscribe for more insightful content! 🚀
Видео Getting the best results from your ML models | Youden's Index канала Six Sigma Pro SMART
Показать
Комментарии отсутствуют
Информация о видео
Другие видео канала
 Ensemble Machine Learning Technique: Bagging | Bootstrap Aggregation
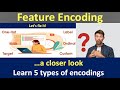 The A to Z of Feature Encoding | Label Encoding | One Hot Encoding | Data Preprocessing in Python
 Ensemble Machine Learning Technique: Voting
 Hands-on Hyperparameter Tuning | Grid Search
 Importance of Weight Initialization in Neural Networks | Deep Learning basics
 Complete guide to hands-on A/B Testing | A/B testing in Python | All that you need to know
 ANOVA: Behind the scenes | Uncover the logic | Hypothesis Testing | Data Science
 The A to Z of Support Vector Machines | All you need to know | Supervised Learning | Data Science
 The journey of a neuron | Geometric intuition
 Text Preprocessing | Case Conversion | Unwanted Patterns | Stopwords | Stemming | Lemmatization
 Getting started with Neural Networks
 Hands-on Text Preprocessing in Python Part 2 | Natural Language Processing basics
 Python: Regular Expressions for beginners
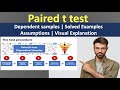 Visual Explanation | Solved Example | Paired t test | Dependent Samples t test | Hypothesis Testing
 The journey of a neuron | The Perceptron
 Hands-on Feature Selection in Python | Choose just the right features for your model | Data Science
 Working with Pandas DataFrames Part 2 | Pandas in Python | Python for beginners | Data Science
 Treating duplicate rows
 What is Point-Biserial correlation? | Theory + Hands-on | All that you need to know
 Confusion Matrix | Classification Accuracy Precision Recall | Supervised Machine Learning