- Популярные видео
- Авто
- Видео-блоги
- ДТП, аварии
- Для маленьких
- Еда, напитки
- Животные
- Закон и право
- Знаменитости
- Игры
- Искусство
- Комедии
- Красота, мода
- Кулинария, рецепты
- Люди
- Мото
- Музыка
- Мультфильмы
- Наука, технологии
- Новости
- Образование
- Политика
- Праздники
- Приколы
- Природа
- Происшествия
- Путешествия
- Развлечения
- Ржач
- Семья
- Сериалы
- Спорт
- Стиль жизни
- ТВ передачи
- Танцы
- Технологии
- Товары
- Ужасы
- Фильмы
- Шоу-бизнес
- Юмор
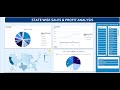
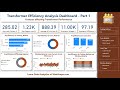
Excel Dashboard - Hotel Guests Stays Data - Exploratory Analysis - Part 1
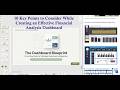
In this video, Ankit Srivastava demonstrates how to create a Hotel Guests Stays Data Exploratory Analysis Dashboard in Excel. Learn step by step how to analyze guest demographics, booking channels, room fares, and feedback ratings using PivotTables, PivotCharts, and slicers. Ankit also shows powerful Excel tricks like building Map Charts and Histograms using dynamic ranges, since they are not directly supported by PivotTables. This dashboard helps hotels understand customer behavior, optimize revenue, and improve guest satisfaction.
Get the dataset here: https://colorstech.net/exel-dashboard-tutorials/hotel-guests-stays-data-exploratory-analysis-in-excel-step-by-step-tutorial/
#exceldashboards #exceltutorial #exceltips #dataanlysis #hospitality
Follow Us:
https://facebook.com/slidescope
https://instagram.com/slidescope
Видео Excel Dashboard - Hotel Guests Stays Data - Exploratory Analysis - Part 1 канала Colorstech Training (By Slidescope)
Комментарии отсутствуют
Информация о видео
30 сентября 2025 г. 13:38:13
00:53:49
Другие видео канала