The simplest way to make bell curve from your data - Do you know this? 🔔📉
Excel Bell curves or frequency distribution curves are handy for analysing and understanding distribution of your data. Recently, someone asked me to make a bell-curve to visualize salary distribution of staff. While you can use formulas or complex techniques to make these, I used a simple trick to make the bell curve and add interactive effect to it. Needless to say, my clients were impressed.
Let me show the method in this video and take it to next level.
Time stamps for the video:
====================
0:00 - The bell curve problem
0:36 - Making the bell curve with Excel
3:27 - Adding department as slicer
3:54 - Fixing the axis issues
4:48 - Taking the bell curve to next level (splitting it by gender)
5:42 - Closing remarks
Example file:
==========
https://chandoo.org/wp/wp-content/uploads/2021/04/bell-curve.xlsx
👉Checkout my online course on Advanced Excel & Data analysis
===================================================
💻📗💥 https://chandoo.org/wp/excel-school-program/
#Excel #BellCurve
Видео The simplest way to make bell curve from your data - Do you know this? 🔔📉 канала Chandoo
Показать
Комментарии отсутствуют
Информация о видео
Другие видео канала
 Normal Distribution bell curve in Excel
 Creating Normal Curve (Bell Shape Curve) in Excel 2016 (Office 365) Not Shaded
 How to create a Bell Curve and Histogram from the Normal Distribution
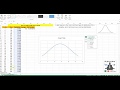 How to Create Bell Curve in Excel
 Probably the easiest dashboard trick EVER ~ Link up two charts to the same slicer
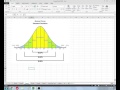 How to Do a T-Test for Beginners
 Making a Bell Curve and Assessing Normalcy in Google Sheets – Statistics Tutorials
 AWESOME Excel trick to combine data from multiple sheets
 Bill Jelen - MrExcel's Best Excel Tips (including a secret tip from FBI 😮)
 10 awesome things you can do in Excel - WITHOUT any formulas or pivots
 How to create a bell curve in normal distribution Excel training
 Understanding the bell curve method for performance rating | Chatter Matar Hindi
 Try this SMART formula to calculate YTD in Excel (works for Financial Years too!)
 10 things you thought Excel couldn't do, BUT it does them SO WELL
 How to Make a Bell Curve in Microsoft Excel
 How to make a sexy interactive chart slider thingy in Excel?
 Make Quarterly Reports quickly with this AWESOME Excel Trick 💡
 Normal Distribution Tool Build
 Advanced Gantt chart in Excel with drill-down feature