Build an Interactive Excel Dashboard From Scratch
How to build a dynamic and interactive Excel dashboard from scratch.
🆓 DOWNLOAD Free Excel file for this video: https://view.flodesk.com/pages/626c3ec146c9ddac82189452
👉 Excel for Business & Finance Course: https://www.careerprinciples.com/courses/excel-for-business-finance
In this video you will learn create an interactive excel dashboard step-by-step. We'll start with a large dataset on beverage giant coca-cola. Once we convert this dataset into a table, we'll start our dashboard analysis. First, we'll create summary of the key financial figures using sums and averages on pivot tables.
Then, we'll create a monthly breakdown for the products using a pivot chart and a timeline so you can update the length according to your needs.
Thirdly, we'll create a breakdown by region using pivot tables and a map chart of the US.
Lastly, we'll make the dashboard dynamic / interactive using pivot table slicers and making sure to filter the connections so everything updates automatically.
LEARN:
📈 The Complete Finance & Valuation Course: https://www.careerprinciples.com/courses/finance-valuation-course
👉 Excel for Business & Finance Course: https://www.careerprinciples.com/courses/excel-for-business-finance
📊 Get 25% OFF Financial Edge Using Code KENJI25: https://bit.ly/3Ds47vS
📝 Investment Banking Recruiting Course: https://learn.careerprinciples.com/courses/the-complete-investment-banking-recruiting-course
SOCIALS:
📸 Instagram - https://www.instagram.com/kenji_explains/
🤳 TikTok - https://www.tiktok.com/@kenjiexplains?lang=en
GEAR:
📹 My Favorite Books & Gear: https://kit.co/kenjiexplains
▬▬▬▬▬▬▬▬▬▬▬▬▬▬▬▬▬▬▬▬▬▬▬▬▬▬▬▬▬▬▬▬▬▬▬▬▬▬▬▬
Chapters:
0:00 - Summary of Key Financials
2:50 - Area Chart
4:58 - Monthly Sales Chart
5:04 - PivotChart Timeline
7:33 - Map Chart
10:18 - Making Everything Dynamic With Slicers
12:28 - Customizing the Dashboard Layout
Disclaimer: I may receive a small commission on some of the links provided at no extra cost to you.
Видео Build an Interactive Excel Dashboard From Scratch канала Kenji Explains
Показать
Комментарии отсутствуют
Информация о видео
Другие видео канала
 Make Awesome Excel Visuals like The Economist Magazine
 Excel for Finance: 10 Formulas You NEED to KNOW
 Make a Search Bar in Excel to Find Anything!
 Essential Excel Skills for Data Analysis
 Python in Excel! MAJOR Upgrade for Data Analysis & Visualization
 5 Advanced Excel Formulas You Probably Didn't Know!
 New Excel Formulas for 2023! #shorts
 The ULTIMATE Index Match Tutorial (5 Real-World Examples)
 Learn Excel VBA to Automate Anything
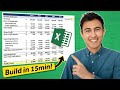 Build a Dynamic Financial Model in Just 15 Minutes
 5 Awesome Excel Shortcuts to Save You Hours of Time!
 3 Excel Interview Questions in 60 seconds #shorts
 Zero to One Book Review | How to Build the Next Billion-Dollar Startup
 Q&A | You asked, I answered
 Investing in Real Estate through REITs
 Inflation Explained for Beginners
 Investing for Beginners | How to get started