Forest Plot Interpretation - Clearly Explained
A forest plot is an important part of a meta-analysis. In this video, I will explain what a forest plot actually is and I will clearly explain how to interpret.
HOW I CREATED THIS TUTORIAL (AFFILIATE LINKS)
Screen recorder & editor https://techsmith.z6rjha.net/c/1988496/506622/5161
YouTube SEO https://www.tubebuddy.com/SHTeach
Software (Microsoft PowerPoint 365 ProPlus)
FOLLOW US
Website https://toptipbio.com/
Facebook https://www.facebook.com/TopTipBio/
Twitter https://twitter.com/TopTipBio
AFFILIATE DISCLAIMER
Some of the above links are affiliate links, meaning I will earn a commission if a sale is made after clicking on the link.
Видео Forest Plot Interpretation - Clearly Explained канала Top Tip Bio
Показать
Комментарии отсутствуют
Информация о видео
Другие видео канала
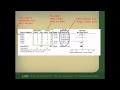 How to Interpret a Forest Plot
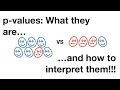 p-values: What they are and how to interpret them
 NCCMT - URE - Making Sense of a Standardized Mean Difference
 #neetpg#fmge#AIIMS FOREST PLOT & FUNNEL PLOT(Interpretation with MCQ), PSM lecture
 How To Create A Forest Plot In Excel (Odds Ratios)
 How to Interpret and Use a Relative Risk and an Odds Ratio
 Interpreting a forest plot of a meta-analysis
 What is Heterogeneity?
 RevMan Tutorial - Entering Data For Meta-Analysis
 Fixed Effects and Random Effects Models
 Confidence Interval Interpretation. 95% Confidence Interval 90% 99%
 Intro to Systematic Reviews & Meta-Analyses
 NCCMT - URE - Forest Plots - Understanding a Meta-Analysis in 5 Minutes or Less
 The Bonferroni Correction - Clearly Explained
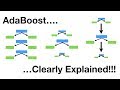 AdaBoost, Clearly Explained
 Summary Measures Used in Systematic Reviews
 Calculating the risk ratio, odds ratio and risk difference in a randomised controlled trial
 Effect size calculation and basic meta-analysis, David B. Wilson
 Creating publication-quality forest plots in Excel | Spreadsheet Synthesis
 How To Calculate A Weighted Average In Excel (With Percentages!)