- Популярные видео
- Авто
- Видео-блоги
- ДТП, аварии
- Для маленьких
- Еда, напитки
- Животные
- Закон и право
- Знаменитости
- Игры
- Искусство
- Комедии
- Красота, мода
- Кулинария, рецепты
- Люди
- Мото
- Музыка
- Мультфильмы
- Наука, технологии
- Новости
- Образование
- Политика
- Праздники
- Приколы
- Природа
- Происшествия
- Путешествия
- Развлечения
- Ржач
- Семья
- Сериалы
- Спорт
- Стиль жизни
- ТВ передачи
- Танцы
- Технологии
- Товары
- Ужасы
- Фильмы
- Шоу-бизнес
- Юмор
HR Analytics Dashboard – Level 2 (Power BI) | Included Dashboard And Raw File To Download
HR Analytics Dashboard – Level 2 (Power BI)
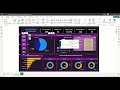
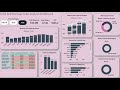
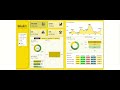
This dashboard provides a strategic lens into workforce trends, employee behavior, and HR performance metrics. Built with Power BI, it combines interactive visuals and DAX-driven insights to support data-driven HR decisions.
Download File 👇👇👇:
https://drive.google.com/drive/folders/1OkIlhG1ItfPaZsZGiTgDR_hA5YseziFh?usp=drive_link
🔍 Key Insights & Visuals:
Employee Overview: Total headcount, active employees, average age, and gender distribution.
Attrition Analysis: Attrition count and rate, department-wise attrition, and attrition by gender and age group.
Job Satisfaction: Heatmap or matrix showing satisfaction levels by job role or department.
Education & Demographics: Attrition by education field, employee count by age group, and diversity breakdown.
Performance & Tenure: Average years at company, performance ratings (if available), and promotion trends.
Interactive Filters: Slicers for department, job role, gender, and education to enable dynamic exploration.
⚙️ Technical Highlights:
DAX Measures: Custom KPIs like Attrition Rate, Average Age, and Job Satisfaction Score.
Drill-through Pages: Deep dives into department-level or individual-level data.
Clean UI/UX: Consistent color palette, iconography, and bookmarks for smooth navigation.
#PowerBI #HRAnalytics #PowerBIDashboard #DataAnalytics #BusinessIntelligence
#DataVisualization #PowerBITutorial #DashboardDesign #AnalyticsWithSomu
#CareerInData #DataDrivenHR #PowerBISkills #HRDashboard #DataStorytelling
Видео HR Analytics Dashboard – Level 2 (Power BI) | Included Dashboard And Raw File To Download канала SomuDataGeek
Комментарии отсутствуют
Информация о видео
25 июня 2025 г. 18:45:09
00:09:08
Другие видео канала