Matlab Surface Plot XYZ Data
In this video, you will see an easy method to plot a surface in Matlab. It's a great way to visualize a function with two variables for instance.
Meshgrid, Surf, Matlab
Видео Matlab Surface Plot XYZ Data канала MatlabTricks
Meshgrid, Surf, Matlab
Видео Matlab Surface Plot XYZ Data канала MatlabTricks
Показать
Комментарии отсутствуют
Информация о видео
Другие видео канала
 test
test EXCEL Beginner Tips (or HOW TO NOT LOSE YOUR MIND)
 No1 Most Useful EXCEL Tips (for large data sets)
 Fahrenheit to Celsius (-273.15 to 6000 °C)
 A Simple MATLAB Animation: Calorie Consumption
 54 Years of Carbon Emissions vs. Gross Domestic Product
 Stronger WiFi Singal AND Less EMF Simultaneously (!)
 Royal Crown of Youtube
 200 Million Chinese Might Die From This | Shooking Smooking Stats
 Covid-19 Statistics & Ugandas Epic Public Health Info (must see)
 COVID 19: Then Will The Curve Flatten?
 A 50,000 Dollar Drone Takes of (used for science)
 Extracting Data from a Chart - Image Processing with Matlab
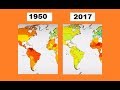 Population Growth Rate | Year by Year 1951-2017
 The Ring Finder - A Matlab Excercise
 The Zeroth lesson of Matlab
 Text Style in MATLAB: Listfonts
 Real Size of Country Comparision
 Chinese Classic IQ-test
 Left or Right Earphone? Interactive Video
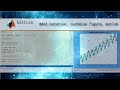 Customize Matlab Graphs (Using dot notation)