Japanese Candlestick Pattern That's Rarely Taught
A Unique Japanese Candlestick Pattern that's very few people know is one of the best I've ever seen for stocks, futures & Forex
http://www.topdogtrading.net/youtubeorganic-trading
Here's how to read pure price patterns based on this unusual 2-bar
Japanese Candlestick Pattern strategy
Enjoy the video! Leave your questions and comments below!
Make sure not to miss a single video from Barry! Click here to Subscribe:
https://www.youtube.com/user/TopDogTrading?sub_confirmation=1
====================================================
Barry Burns
Top Dog Trading
TopDogTrading.com
Facebook: https://www.facebook.com/TopDogTrading/
Get the Free Trade Strategy: “The Rubber Band Trade”:
http://www.topdogtrading.net/youtubeorganic-trading
===================================================
Watch the related video: "Leading Indicators Examples:"
https://www.youtube.com/watch?v=zvHIOuKjQbw&t=11s
---
Risk Disclosure: http://bit.ly/Risk-Disc
---
RISK DISCLAIMER:
The information contained on this video is for informational and educational purposes only. We are not registered as a securities broker-dealer or as investment advisers, either with the U.S. Securities and Exchange Commission or with any state securities regulatory authority. We are neither licensed nor qualified to provide investment advice. Trading and investing involves substantial risk. Financial loss, even above the amount invested, is possible. Seek the services of a competent professional person before investing or trading with money.
The information contained on this video, is not provided to any particular individual with a view toward their individual circumstances and nothing in this video should be construed as investment or trading advice. Each individual should assume that all information contained on this site is not trustworthy unless verified by their own independent research.
Any statements and/or examples of earnings or income, including hypothetical or simulated performance results, are solely for illustrative purposes and are not to be considered as average earnings. Prior successes and past performance with regards to earnings and income are not an indication of potential future success or performance.
You should never trade with money you cannot afford to lose. The information in this video is in no way a solicitation of any order to buy or sell. The author and publisher assume no responsibility for your trading results.
This information is provided "AS IS," without any implied or express warranty as to its performance or to the results that may be obtained by using the information.
Factual statements in this site are made as of the date the information was created and are subject to change without notice.
HYPOTHETICAL OR SIMULATED PERFORMANCE RESULTS HAVE CERTAIN INHERENT LIMITATIONS. UNLIKE AN ACTUAL PERFORMANCE RECORD, SIMULATED RESULTS DO NOT REPRESENT ACTUAL TRADING. ALSO, SINCE THE TRADES HAVE NOT ACTUALLY BEEN EXECUTED, THE RESULTS MAY HAVE UNDER- OR OVER-COMPENSATED FOR THE IMPACT, IF ANY, OF CERTAIN MARKET FACTORS, SUCH AS LACK OF LIQUIDITY. SIMULATED TRADING PROGRAMS IN GENERAL ARE ALSO SUBJECT TO THE FACT THAT THEY ARE DESIGNED WITH THE BENEFIT OF HINDSIGHT. NO REPRESENTATION IS BEING MADE THAT ANY ACCOUNT WILL OR IS LIKELY TO ACHIEVE PROFITS OR LOSSES SIMILAR TO THOSE SHOWN.
Видео Japanese Candlestick Pattern That's Rarely Taught канала TopDogTrading
http://www.topdogtrading.net/youtubeorganic-trading
Here's how to read pure price patterns based on this unusual 2-bar
Japanese Candlestick Pattern strategy
Enjoy the video! Leave your questions and comments below!
Make sure not to miss a single video from Barry! Click here to Subscribe:
https://www.youtube.com/user/TopDogTrading?sub_confirmation=1
====================================================
Barry Burns
Top Dog Trading
TopDogTrading.com
Facebook: https://www.facebook.com/TopDogTrading/
Get the Free Trade Strategy: “The Rubber Band Trade”:
http://www.topdogtrading.net/youtubeorganic-trading
===================================================
Watch the related video: "Leading Indicators Examples:"
https://www.youtube.com/watch?v=zvHIOuKjQbw&t=11s
---
Risk Disclosure: http://bit.ly/Risk-Disc
---
RISK DISCLAIMER:
The information contained on this video is for informational and educational purposes only. We are not registered as a securities broker-dealer or as investment advisers, either with the U.S. Securities and Exchange Commission or with any state securities regulatory authority. We are neither licensed nor qualified to provide investment advice. Trading and investing involves substantial risk. Financial loss, even above the amount invested, is possible. Seek the services of a competent professional person before investing or trading with money.
The information contained on this video, is not provided to any particular individual with a view toward their individual circumstances and nothing in this video should be construed as investment or trading advice. Each individual should assume that all information contained on this site is not trustworthy unless verified by their own independent research.
Any statements and/or examples of earnings or income, including hypothetical or simulated performance results, are solely for illustrative purposes and are not to be considered as average earnings. Prior successes and past performance with regards to earnings and income are not an indication of potential future success or performance.
You should never trade with money you cannot afford to lose. The information in this video is in no way a solicitation of any order to buy or sell. The author and publisher assume no responsibility for your trading results.
This information is provided "AS IS," without any implied or express warranty as to its performance or to the results that may be obtained by using the information.
Factual statements in this site are made as of the date the information was created and are subject to change without notice.
HYPOTHETICAL OR SIMULATED PERFORMANCE RESULTS HAVE CERTAIN INHERENT LIMITATIONS. UNLIKE AN ACTUAL PERFORMANCE RECORD, SIMULATED RESULTS DO NOT REPRESENT ACTUAL TRADING. ALSO, SINCE THE TRADES HAVE NOT ACTUALLY BEEN EXECUTED, THE RESULTS MAY HAVE UNDER- OR OVER-COMPENSATED FOR THE IMPACT, IF ANY, OF CERTAIN MARKET FACTORS, SUCH AS LACK OF LIQUIDITY. SIMULATED TRADING PROGRAMS IN GENERAL ARE ALSO SUBJECT TO THE FACT THAT THEY ARE DESIGNED WITH THE BENEFIT OF HINDSIGHT. NO REPRESENTATION IS BEING MADE THAT ANY ACCOUNT WILL OR IS LIKELY TO ACHIEVE PROFITS OR LOSSES SIMILAR TO THOSE SHOWN.
Видео Japanese Candlestick Pattern That's Rarely Taught канала TopDogTrading
Показать
Комментарии отсутствуют
Информация о видео
Другие видео канала
 Candlestick Analysis for Professional Traders
 Five Power Candlestick Patterns in Stock Trading Strategies by Adam Khoo
 Leading Indicators Examples
 4 Reversal Chart Patterns You Should Know 💹
 Best Candlesticks Patterns | Japanese Candlesticks Chart | Reversal Chart Patterns
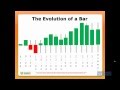 TopstepTrader - Mastering Candlestick Math
 How Can You Tell the Difference between a Retracement and a Reversal with Barry Norman
 Learning to Read Candlestick Pattern Formations
 Success Story -80K-1Laks per month from a Part Time Trader
 RSI Indicator Secrets: Powerful Trading Strategies to Profit in Bull & Bear Markets
 Barry Norman Explains How To Trade Triangles Successfully
 Trending Engulfing Candlestick Strategy Pattern
 5 Most Profitable Candlestick Patterns - How to Read Stock Charts
 How to Read Candlestick Charts
 Inside Bar Trading Strategy: How to capture momentum and ride trends (with low risk)
 Trend Trading Secrets
 6 Reversal Candlestick Patterns For Explosive Gains
 The Only Overbought Oversold Indicator That Works
 Candlestick Chart Trading - What Works Today
 CCI Indicator Strategy for Winning Trades