Spectrofluorimetry/Fluorimetry/Fluorescence Spectroscopy|Principle, Instrumentation, Applications
This video explains about the principle of fluorescence spectroscopy or spectrofluorimetry. It discusses the process of fluorescence with the Jablonski's diagram. It distinguishes the difference between excitation and emission spectrum. The instrumentation of spectrofluorimetry is discussed. The advantages, disadvantages and applications of spectrofluorimetry are also enumerated.
You will be able to
discuss the principles of spectrofluorimetry
State Stoke’s law or Stoke’s shift
distinguish between the excitation and emission fluorescence spectrum
explain the instrumentation in detail and working of spectrofluorimetry
list out the advantages, disadvantages and applications of spectrofluorimetry.
Principle of Spectrofluorimetry/ Principle of Fluorescence spectroscopy
Spectrofluorimetry or fluorescence spectroscopy is a technique in which UV/Visible light is absorbed by electrons in singlet ground state to move to singlet excited state and returns back to the singlet ground state by emitting radiation (fluorescence) with lower energy (longer wavelength) or same energy to give rise to fluorescence spectroscopy.
Excitation fluorescence spectrum
Emission fluorescence spectrum
Stoke’s shift or Stoke’s law
The fluorescence occurs at a longer wavelength than the excitation wavelength (Difference between the wavelength of emission maxima and absorption maxima)
Resonance fluorescence
The fluorescence wavelength is equal to the excitation wavelength (The process of re-emitting the absorbed energy in the form of light).
Excitation spectrum
plot of intensity of fluorescence emission as a function of excitation wavelength.
Lowest vibrational level of S0 to any vibrational level of S1, S2 etc.
So a band is obtained.
Emission/Fluorescence spectrum
plot of intensity of fluorescence emission against the emission wavelength.
Lowest vibrational level of S1 to any vibrational level of S0.
So a band is obtained.
Instrumentation & working of Spectrofluorimetry/ Instrumentation & working of Fluorescence spectroscopy
Source – Supplies light in the l = 200-800nm - Xenon lamp.
Excitation monochromator – Allows only the excitation wavelength one at a time and absorbs all the other wavelengths and this happens for the complete chosen range of wavelength. eg. diffraction grating.
Sample cell (cuvette) – Sample is placed in it and the cell is polished on all the four sides, as the fluorescence emission is measured at 90o to the incident light. eg. quartz.
Emission/Fluorescence monochromator - Allows only the emission wavelength one at a time and absorbs all the other wavelengths and this happens for the complete chosen range of wavelength. eg. diffraction grating.
Detector – It detects the intensity of the fluorescence light for each wavelength and generates current proportional to it. eg. photomultiplier tube.
Recorder – It records
Excitation fluorescence spectrum – plot of intensity of fluorescence as a function of excitation wavelength.
Emission fluorescence spectrum - plot of intensity of fluorescence against the emission wavelength.
Advantages of Spectrofluorimetry/Advantages of Fluorescence spectroscopy
High sensitivity (ng/ml to mg/ml).
High selectivity (fluorescent substances show specific excitation and emission lmax value).
Disadvantages of Spectrofluorimetry/Disadvantages of Fluorescence spectroscopy
All compounds do not fluoresce.
It is not suitable for identification of compounds.
Contaminants can quench fluorescence and mislead the results.
It is susceptible to pH, solvent polarity, temperature etc.
Applications of Spectrofluorimetry/Applicationsof Fluorescence spectroscopy
Fluorescent probes to detect biological compounds.
Detection of the environmental pollutants.
In geology many minerals and gems can be identified.
Steroids, proteins, plant pigments, drugs can be identified even at low concentrations.
Fluorescent compounds in TLC plates.
Fluorescent detectors are used in HPLC.
Determination of vitamins in food samples, natural products, pharmaceuticals, clinical samples.
Видео Spectrofluorimetry/Fluorimetry/Fluorescence Spectroscopy|Principle, Instrumentation, Applications канала Revathi Purushothaman
Показать
Комментарии отсутствуют
Информация о видео
26 сентября 2020 г. 14:21:11
00:13:21
Другие видео канала
 Learn about Spectrofluorimeter in 4 min | Construction and working of spectrofluorimeter | AI 07
 Fluorescence Spectroscopy Tutorial - Basics of Fluorescence
 Fluorimetry - Working principles & Sample analysis
 Fluroscence spectroscopy / flurometry /spectroflurometry
 Explain the principle of Fluorescence and Phosphorescence. | Analytical Chemistry
 Lecture 13 : Fluorescence Spectroscopy
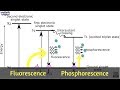 Basics and principle of Fluorescence & Phosphorescence measurement | Learn under 5 min | AI 06
 Fluorimetry, Theory of Fluorescence &Phosphorescence, 7th sem unit 1. @Knowlede of pharma
 Lecture 6 : Fluorescence Spectroscopy
 Quantum Yield Introduction using FS5 Spectrofluorometer
 FLUORESCENCE (SPECTROFLUORIMETRY OR FLUORESCENCE SPECTROSCOPY ) ALSO KNOWN AS FLUORIMETRY
 Jablonski diagram / Perrrin-jablonski diagram
 Fluorimetry Theory factors affecting fluorescence quenching
 Fluorescence Spectroscopy Tutorial - Typical Applications
 Fluorescence microscopy principle and working
 Describe the instrumentation of Fluorometry? | Analytical Chemistry
 Fluorescence Spectroscopy and its application in medical field
 Fundamentals of Fluorescence
 Electronic Spectroscopy | Franck - Condon Principle