Using the RVOL Indicator to aid Trend and Trading Range Predictions | Part 7
When trading using a systematic approach, it is often challenging to know when trends and trading ranges will start and end. The RVOL Relative Volume indicator can provide valuable insights to help you turn the probabilities of making good decisions more in your favor.
The RVOL Relative Volume indicator can be used to gauge trader commitment to each price move and thus provide valuable clues as to whether reversals, continuations or trading ranges are likely to develop next.
Brought to you by Darwinex: UK FCA Regulated Broker, Asset Manager & Trader Exchange where Traders can legally attract Investor Capital and charge Performance Fees:
https://www.darwinex.com/?utm_source=youtube&utm_medium=video-description-above-fold&utm_content=mt-atfal-volume-data-67
Darwinex is making the code for the RVOL Indicator available to Subscribers of the Darwinex YouTube Channel: https://github.com/darwinex/advanced-mql-programming/blob/master/RVOL-Indicator/RVOL.mq5
#TradingRange, #PriceTrend, #RelativeVolume, #RVOLIndicator, #RelativeVolumeIndicator, #RVOL, #SystematicTrading, #AlgorithmicTrading, #AlgoTrading, #FX, #CFD, #CommodityFutures, #Darwinex
This is Episode 67 in the Darwinex 'Algo Trading for a Living' Playlist, and Episode 7 of the new 'Volume Data' mini-series.
Video Contents:
00:00 Introduction
00:40 Inter-relationships between price action and volume
01:24 Introduction to RVOL examples
01:42 Viewing the RVOL indicator on a price chart
03:03 Analysing RVOL for trends
03:22 RVOL clues of a reversal
05:39 RVOL at support and resistance levels
06:49 Trend pullbacks and RVOL
08:03 RVOL predicting the start of a 'trading range'
09:14 Key insights from RVOL that can't be ascertained from price action alone
10:10 A further RVOL prediction of a trading range
11:16 RVOL and probability analysis
12:37 Summary and Conclusions
Content Disclaimer: Past performance is not a reliable indicator of future results. The contents of this video (and all other videos by the presenter) are for educational purposes only and are not to be construed as financial and/or investment advice.
Risk disclosure:
https://www.darwinex.com/legal/risk-disclaimer
Видео Using the RVOL Indicator to aid Trend and Trading Range Predictions | Part 7 канала Darwinex
Показать
Комментарии отсутствуют
Информация о видео
Другие видео канала
 How the RVOL Indicator Informs Breakout Strategies & Helps Avoid False Breakouts
 The KAMA Indicator Calculation | How and why it works | Kaufman Adaptive Moving Average
 25) How Triple Moving Averages Help Classify Market Regimes | Technical Trading
 Using Volume Data and Volume Indicators to Improve Trading Decisions | Part 1 | Volume Basics
 How the On-Balance Volume (OBV) Indicator can Improve your Trading Strategy
 Money Flow Index Explained | A Volume-Based Indicator
 15) Using a 'percent-based' ATR (Average True Range) Volatility Filter
 How the RVOL Relative Volume Indicator can Improve your Trading Strategies | Part 6
 Stop Loss Techniques for Trend-Continuation Trading Strategies
 The Kaufman Adaptive Moving Average Indicator (KAMA)
 Systematic Trading Clues to a Trend Finishing and a Trading Range Starting | Volume Indicators
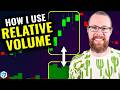 Beginner Day Trading Strategy using RV % Gainer and Float
 The Best 5 Confirmation indicators on Tradingview, Top 5 Filters for scalping 1 minute 5 minute +H
 10) Technical Indicators - Take this Trading Challenge... If you dare!
 How to "Predict" Mid-Term Market Momentum by Ichimoku Kijun sen / 9 Mar 2022
 How the Ichimoku Indicator Determines Sentiment using Chikou Span
 13) Developing Trading Systems by Combining Technical Indicator Triggers with 'Market Type' Filters
 Money Flow Index | Trading Divergences and Overbought/Oversold