Unifying the Counterfactual and Graphical Approaches to Causality
Models based on potential outcomes, also known as counterfactuals, were introduced by Neyman (1923) and later applied to observational contexts by Rubin (1974). Such models are now used extensively within Biostatistics, Statistics, Political Science, Economics, and Epidemiology for reasoning about causation. Directed acyclic graphs (DAGs), introduced by Wright (1921) are another formalism used to represent causal systems. Graphs are also extensively used in Computer Science, Bioinformatics, Sociology and Epidemiology.
I present a simple approach to unifying these two frameworks via a new graph, termed the Single-World Intervention Graph (SWIG). The SWIG encodes the counterfactual independences associated with a specific hypothetical intervention on a set of treatment variables. The nodes on the SWIG are the corresponding counterfactual random variables. The SWIG is derived from a causal DAG via a simple node splitting transformation. I will illustrate the theory with a number of examples. Finally I show that SWIGs avoid a number of pitfalls that are present in an alternative approach to unification, based on `twin networks' that has been advocated by Pearl (2000).
Видео Unifying the Counterfactual and Graphical Approaches to Causality канала Fung Institute for Engineering Leadership
Показать
Комментарии отсутствуют
Информация о видео
20 марта 2014 г. 23:47:52
01:24:07
Другие видео канала
 Causal inference in observational studies: Emma McCoy, Imperial College London
 Susan Athey: Counterfactual Inference (NeurIPS 2018 Tutorial)
 Introduction to causal inference in complex longitudinal settings 2
 UC Berkeley Master of Engineering: Admissions Overview
 CCN 2019: Tutorial T-B Causal inference
 Counterfactual Fairness
 Modern Data Analysis for Economics: Foundations of Causal Inference (Part II)
 What is Engineering Leadership?
 UC Berkeley Master of Engineering: Program Overview
 Basic Issues of Impact Evaluation
 UC Berkeley Master of Engineering: Capstone Experience
 Engineering Leadership to Transform the World and Your Career
 Tutorial Session B - Causes and Counterfactuals: Concepts, Principles and Tools.
 #11 F-test for overall significance in regression example
 How to detect and remove auto correlation (serial correlation)
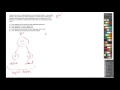 Randomized Controlled Trial v. Prospective Cohort Study, QUESTION STEM
 Easy Econometric Series | Coefficient of Multiple Determination | R-square | Adjusted R