- Популярные видео
- Авто
- Видео-блоги
- ДТП, аварии
- Для маленьких
- Еда, напитки
- Животные
- Закон и право
- Знаменитости
- Игры
- Искусство
- Комедии
- Красота, мода
- Кулинария, рецепты
- Люди
- Мото
- Музыка
- Мультфильмы
- Наука, технологии
- Новости
- Образование
- Политика
- Праздники
- Приколы
- Природа
- Происшествия
- Путешествия
- Развлечения
- Ржач
- Семья
- Сериалы
- Спорт
- Стиль жизни
- ТВ передачи
- Танцы
- Технологии
- Товары
- Ужасы
- Фильмы
- Шоу-бизнес
- Юмор
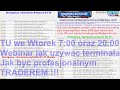
FOREX DAYLY SIGNAL SUPERVISOR GOLD LIVE TRADING BTC LIVE TRADING HARMONIC MONITOR ALL F R E E ! ! !
Welcome to Forex Underground Channel
TEAMS CONTACT: Forex Underground
https://teams.live.com/l/invite/FEAD8rcffdrKv1yMQI?v=g1
BLUEBERRY - Trust broker
https://portal.blueberrymarkets.com/en/sign-up?referralCode=uk0gspbhd5
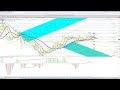
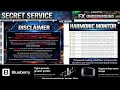
Harmonic Pattern Trading System
Using Live Harmonic Signals, Market Profile, Elliott Waves and DMACD
System Concept
This trading approach is based on real-time harmonic pattern detection, where the key signal occurs when a harmonic structure completes at point D (D = 0).
The system combines four analytical components:
• Harmonic patterns – price geometry and reversal structures
• Market Profile – volume distribution and key market levels
• Elliott Wave structure – market cycle context
• DMACD divergence – momentum confirmation
The objective is to identify high-probability reversal zones where several independent market factors converge.
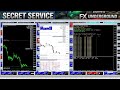
Signal Source
Signals are generated by a live harmonic scanner panel which displays:
• instrument
• timeframe
• detected harmonic pattern
• pattern parameters
• bar point D
The system only considers signals when:
bar point D = 0
This indicates that the harmonic structure has just been completed and the market has entered the Potential Reversal Zone (PRZ).
Trading Logic
When a pattern completes at point D, the system evaluates additional confirmations.
Market Profile Confluence
The PRZ should align with key Market Profile levels:
• POC (Point of Control)
• VAH / VAL
• Low Volume Nodes
Elliott Wave Context
The harmonic structure should appear at typical reversal locations such as:
• end of Wave 5
• end of Wave C
• completion of an ABC correction
DMACD Divergence
Momentum divergence between price and DMACD confirms weakening trend strength.
Trade Direction
Trade direction follows the pattern type:
• Bullish patterns → Buy
• Bearish patterns → Sell
Entry Concept
A trade is executed after price reacts inside the Potential Reversal Zone (PRZ).
Entry confirmation may include:
• rejection candle
• momentum shift
• confirmed divergence
Risk Management
Stop loss is placed:
• beyond the PRZ zone, or
• beyond point X of the harmonic structure.
Profit targets are typically based on Fibonacci retracements of the AD leg.
System Advantage
The strategy combines three independent analytical dimensions:
• price geometry (harmonic patterns)
• market structure (Market Profile)
• momentum (DMACD divergence)
When these elements align at D = 0, the probability of a meaningful market reversal increases.
Monitor Manual
Operational Overview
The system operates in real time, using a monitoring panel that continuously scans the market and displays harmonic patterns across multiple timeframes.
The most important timeframes are:
• H1
• H4
• D1
Signals are generated live as the market evolves.
When a harmonic pattern reaches D = 0, the formation is considered complete and the market enters the Potential Reversal Zone (PRZ). This moment becomes the starting point for further analysis and possible trade execution.
Daily Trading Signals
In addition to the real-time scanner, traders also receive daily trading signals shared in a private Facebook group.
Access to the group:
• $100 per month
• Special promotion – $150 for the first 3 months
The daily analyses focus primarily on two markets:
• Gold (XAUUSD)
• Bitcoin (BTC)
These analyses provide structured market outlooks and live trading signals based on the same analytical framework used in the system.
Additional Trade Opportunities
The terminal also generates additional harmonic pattern alerts for other instruments.
These signals may or may not be traded depending on market conditions and trader discretion.
Every potential setup begins with the D = 0 event, which marks the completion of a harmonic structure and the start of the analytical process.
FX Underground
About Us
At Forex Underground, we provide real-time insights into the dynamic world of financial markets.
Through Live Forex TV broadcasts, our experienced analysts examine market trends, divergences, and harmonic structures while sharing professional forex analysis, trading strategies, and live forex signals.
Our focus includes Gold trading, Bitcoin trading, Forex technical analysis and harmonic trading strategies designed to help traders understand market structure and improve their trading decisions.
Whether you are a beginner or an experienced trader, our channel delivers valuable knowledge, expert insights, and actionable trading ideas to support your trading journey.
Keywords
Forex trading signals, harmonic trading strategy, live forex signals, forex trading system, market profile trading, Elliott wave trading, DMACD divergence, gold trading signals, bitcoin trading signals, forex technical analysis.
Tags
#ForexTrading
#ForexSignals
#LiveForexSignals
#HarmonicTrading
#HarmonicPatterns
#ForexTechnicalAnalysis
#ForexStrategy
#ForexEducation
#GoldTrading
#BitcoinTrading
#BTCTrading
#XAUUSD
#CryptoTrading
#MarketPro
Видео FOREX DAYLY SIGNAL SUPERVISOR GOLD LIVE TRADING BTC LIVE TRADING HARMONIC MONITOR ALL F R E E ! ! ! канала Forex Underground
TEAMS CONTACT: Forex Underground
https://teams.live.com/l/invite/FEAD8rcffdrKv1yMQI?v=g1
BLUEBERRY - Trust broker
https://portal.blueberrymarkets.com/en/sign-up?referralCode=uk0gspbhd5
Harmonic Pattern Trading System
Using Live Harmonic Signals, Market Profile, Elliott Waves and DMACD
System Concept
This trading approach is based on real-time harmonic pattern detection, where the key signal occurs when a harmonic structure completes at point D (D = 0).
The system combines four analytical components:
• Harmonic patterns – price geometry and reversal structures
• Market Profile – volume distribution and key market levels
• Elliott Wave structure – market cycle context
• DMACD divergence – momentum confirmation
The objective is to identify high-probability reversal zones where several independent market factors converge.
Signal Source
Signals are generated by a live harmonic scanner panel which displays:
• instrument
• timeframe
• detected harmonic pattern
• pattern parameters
• bar point D
The system only considers signals when:
bar point D = 0
This indicates that the harmonic structure has just been completed and the market has entered the Potential Reversal Zone (PRZ).
Trading Logic
When a pattern completes at point D, the system evaluates additional confirmations.
Market Profile Confluence
The PRZ should align with key Market Profile levels:
• POC (Point of Control)
• VAH / VAL
• Low Volume Nodes
Elliott Wave Context
The harmonic structure should appear at typical reversal locations such as:
• end of Wave 5
• end of Wave C
• completion of an ABC correction
DMACD Divergence
Momentum divergence between price and DMACD confirms weakening trend strength.
Trade Direction
Trade direction follows the pattern type:
• Bullish patterns → Buy
• Bearish patterns → Sell
Entry Concept
A trade is executed after price reacts inside the Potential Reversal Zone (PRZ).
Entry confirmation may include:
• rejection candle
• momentum shift
• confirmed divergence
Risk Management
Stop loss is placed:
• beyond the PRZ zone, or
• beyond point X of the harmonic structure.
Profit targets are typically based on Fibonacci retracements of the AD leg.
System Advantage
The strategy combines three independent analytical dimensions:
• price geometry (harmonic patterns)
• market structure (Market Profile)
• momentum (DMACD divergence)
When these elements align at D = 0, the probability of a meaningful market reversal increases.
Monitor Manual
Operational Overview
The system operates in real time, using a monitoring panel that continuously scans the market and displays harmonic patterns across multiple timeframes.
The most important timeframes are:
• H1
• H4
• D1
Signals are generated live as the market evolves.
When a harmonic pattern reaches D = 0, the formation is considered complete and the market enters the Potential Reversal Zone (PRZ). This moment becomes the starting point for further analysis and possible trade execution.
Daily Trading Signals
In addition to the real-time scanner, traders also receive daily trading signals shared in a private Facebook group.
Access to the group:
• $100 per month
• Special promotion – $150 for the first 3 months
The daily analyses focus primarily on two markets:
• Gold (XAUUSD)
• Bitcoin (BTC)
These analyses provide structured market outlooks and live trading signals based on the same analytical framework used in the system.
Additional Trade Opportunities
The terminal also generates additional harmonic pattern alerts for other instruments.
These signals may or may not be traded depending on market conditions and trader discretion.
Every potential setup begins with the D = 0 event, which marks the completion of a harmonic structure and the start of the analytical process.
FX Underground
About Us
At Forex Underground, we provide real-time insights into the dynamic world of financial markets.
Through Live Forex TV broadcasts, our experienced analysts examine market trends, divergences, and harmonic structures while sharing professional forex analysis, trading strategies, and live forex signals.
Our focus includes Gold trading, Bitcoin trading, Forex technical analysis and harmonic trading strategies designed to help traders understand market structure and improve their trading decisions.
Whether you are a beginner or an experienced trader, our channel delivers valuable knowledge, expert insights, and actionable trading ideas to support your trading journey.
Keywords
Forex trading signals, harmonic trading strategy, live forex signals, forex trading system, market profile trading, Elliott wave trading, DMACD divergence, gold trading signals, bitcoin trading signals, forex technical analysis.
Tags
#ForexTrading
#ForexSignals
#LiveForexSignals
#HarmonicTrading
#HarmonicPatterns
#ForexTechnicalAnalysis
#ForexStrategy
#ForexEducation
#GoldTrading
#BitcoinTrading
#BTCTrading
#XAUUSD
#CryptoTrading
#MarketPro
Видео FOREX DAYLY SIGNAL SUPERVISOR GOLD LIVE TRADING BTC LIVE TRADING HARMONIC MONITOR ALL F R E E ! ! ! канала Forex Underground
Комментарии отсутствуют
Информация о видео
11 ч. 18 мин. назад
04:25:20
Другие видео канала