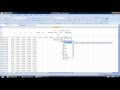
How to Calculate the PSAR Using Excel - Revised Version
The PSAR is a popular technical indicator developed by J.Welles Wilder. It is useful for identifying the trend and as a trailing stop to lock in profits.
▶To get the formulas and more information read the accompanying article here: http://wp.me/p32qmZ-Uo
▶Improve your trading profits with Tradinformed Backtest Models: http://bit.ly/BacktestModels
▶Check out my other Technical Indicator videos: https://www.youtube.com/watch?v=L_PvUlP1si8&list=PLk0Ecq1e4JyGSG_K1_W_uE_oie3HWuVnU
▶How to calculate popular indicators using Excel is the subject of my eBook, available in the Amazon Kindle Store: http://amzn.to/1smFKHr
Follow me on twitter: https://twitter.com/Tradinformed
Facebook: http://on.fb.me/1715mCE
Or Google+ https://plus.google.com/+MarkUrsell/
www.tradinformed.com
Видео How to Calculate the PSAR Using Excel - Revised Version канала Mark Ursell
Показать
Комментарии отсутствуют
Информация о видео
Другие видео канала
 How to Calculate the PSAR Indicator Using Excel
 Forex bot & backtest system with Python #63 - Web dash complete, plotting candles
 How To Calculate RSI Using Excel
 How I Use The TradingView Stock Screener to Find The Best Stocks To Trade - Trading Tutorial
 How to Trade & Calculate the Ichimoku Cloud
 BEST Parabolic SAR Indicator Strategy for Daytrading Crypto, Forex & Stocks (High Profit Strategy)
 How To Get Started in Visual Effects
 Excel Tutorial. Commodity Channel Index Stock Technical Indicator
![How to Calculate RSI Divergence in Excel [Easy to Backtest]](https://i.ytimg.com/vi/1dOloHA765s/default.jpg) How to Calculate RSI Divergence in Excel [Easy to Backtest]
How to Calculate RSI Divergence in Excel [Easy to Backtest]![How to Calculate the WMA in Excel [Easy & Dynamic Formulas]](https://i.ytimg.com/vi/-IqJopMDhiI/default.jpg) How to Calculate the WMA in Excel [Easy & Dynamic Formulas]
How to Calculate the WMA in Excel [Easy & Dynamic Formulas] How to Calculate and use the MACD Indicator in MS Excel
 How to calculate RSI in Excel (Relative Strength Index Indicator)
 🔴 Best "EMA Parabolic SAR" Trading Strategy | Insanely Simple & Profitable Forex & Stocks Trading
 MACD + Parabolic SAR Trading Strategy - VERY PROFITABLE for day trading, swing trading and scalping
 How to use Parabolic SAR strategy Effectively
 S&P 500 Trending Down in 2022 So Far - But What Will It Do Next?
 Stock Price Trends for April - May 2022
 TRADED ICHIMOKU + PARABOLIC SAR 100 TIMES (Revealing Profits)
 50_EMA and 100_EMA Crossover Technical Analysis Scanner in -Python