- Популярные видео
- Авто
- Видео-блоги
- ДТП, аварии
- Для маленьких
- Еда, напитки
- Животные
- Закон и право
- Знаменитости
- Игры
- Искусство
- Комедии
- Красота, мода
- Кулинария, рецепты
- Люди
- Мото
- Музыка
- Мультфильмы
- Наука, технологии
- Новости
- Образование
- Политика
- Праздники
- Приколы
- Природа
- Происшествия
- Путешествия
- Развлечения
- Ржач
- Семья
- Сериалы
- Спорт
- Стиль жизни
- ТВ передачи
- Танцы
- Технологии
- Товары
- Ужасы
- Фильмы
- Шоу-бизнес
- Юмор
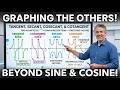
Fitting Curves to Data | Exponential, Logarithmic & Logistic Regression
How do scientists and mathematicians make sense of real-world data? Through regression analysis! In this lesson, we explore how to fit mathematical models to data sets collected from real-world observations
. Learn how to use graphing utilities to perform exponential, logarithmic, and logistic regression
. We will guide you through creating scatter plots, finding the curve that best fits the data, and using these models to make highly accurate predictions about future events
. Take your data analysis and modeling skills to the next level!
___________________________________________________________________________
This video is based on open educational resources, including materials from publicly available academic textbooks.
I do not claim ownership of any original textbook content, figures, or structured materials referenced in this video.
This content is explanation of the topic in simplified form, intended to help students understand the concepts in a more intuitive and accessible way. This video is not a substitute for the original textbooks and is not intended to infringe on any copyright. All credit goes to the respective authors and publishers.
Видео Fitting Curves to Data | Exponential, Logarithmic & Logistic Regression канала Guidance Warehouse Official
Комментарии отсутствуют
Информация о видео
1 мая 2026 г. 16:53:19
00:09:29
Другие видео канала