- Популярные видео
- Авто
- Видео-блоги
- ДТП, аварии
- Для маленьких
- Еда, напитки
- Животные
- Закон и право
- Знаменитости
- Игры
- Искусство
- Комедии
- Красота, мода
- Кулинария, рецепты
- Люди
- Мото
- Музыка
- Мультфильмы
- Наука, технологии
- Новости
- Образование
- Политика
- Праздники
- Приколы
- Природа
- Происшествия
- Путешествия
- Развлечения
- Ржач
- Семья
- Сериалы
- Спорт
- Стиль жизни
- ТВ передачи
- Танцы
- Технологии
- Товары
- Ужасы
- Фильмы
- Шоу-бизнес
- Юмор
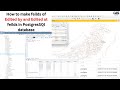
How to make Urban Sprawl Map 1990 - 2023 || Urban Growth || Urban Sprawl Map || Google Earth Engine
This code is written in Google Earth Engine (GEE) JavaScript API and is used for analyzing urban
expansion over a series of years using Landsat satellite imagery. Let's break down the code and
understand its functionality:
### Variables and Functions:
1. **Year List:**
```javascript
var yearList = [1990, 1995, 2000, 2005, 2010, 2015, 2020];
```
This array contains the years for which the analysis will be performed.
2. **Filtering Function:**
```javascript
function filterCol(col, roi, date) {
return col.filterDate(date[0], date[1]).filterBounds(roi);
}
```
This function filters a given image collection (`col`) based on a date range (`date`) and a region of
interest (`roi`).
3. **Cloud Masking Functions:**
Two functions, `cloudMaskTm` and `cloudMaskOli`, are defined for cloud masking in Landsat images.
4. **Composite Functions:**
Two functions, `landsat457` and `landsat89`, are defined to create composite images for Landsat 4, 5,
and 7 (for years before 2014) and Landsat 8 and 9 (for years from 2014 onward), respectively.
5. **Generate Image per Year Function:**
```javascript
var builtCol = ee.ImageCollection(yearList.map(function (year) {
// ...
}));
```
This function generates a collection of images for each year using Landsat data, applies cloud masking,
and calculates indices such as NDBI and MNDWI. It also adds these layers to the GEE map.
### Image Generation and Visualization:
The code then goes through each year in `yearList`, decides which Landsat collection to use based on the
year, generates a composite image, calculates indices, and visualizes the results on the map.
### Urban Expansion and Visualization:
```javascript
var urbanExpansion = builtCol.select('built').min().set(dict);
Map.addLayer(urbanExpansion, {}, 'Urban_expansion');
```
This section creates an image representing the minimum built-up class value for each pixel over the
years. The results are visualized on the map as "Urban Expansion."
### Legend and Visualization:
```javascript
var legend = ui.Panel([ui.Label('Urban expansion')], ui.Panel.Layout.flow('vertical'), { position: 'bottomleft' });
yearList.map(function(year, index){
// ...
});
Map.add(legend);
```
A legend is created and added to the map, showing the color-coded classes for each year of urban
expansion.
### Area Chart:
```javascript
var areaChart = ui.Chart.image.series(builtCol.select('area'), roi, ee.Reducer.sum(), 30, 'year')
.setChartType('AreaChart')
.setOptions({
title: 'Urban area (Ha)',
hAxis: { title: 'Year' },
vAxis: { title: 'Area (Ha)' }
});
print(areaChart);
```
This section generates and prints an area chart showing the change in urban area over the specified
years.
### Summary:
The code performs a comprehensive analysis of urban expansion over a series of years using Landsat
satellite imagery. It involves filtering, cloud masking, index calculation, visualization, and charting to
provide a detailed understanding of urban growth over time.
Видео How to make Urban Sprawl Map 1990 - 2023 || Urban Growth || Urban Sprawl Map || Google Earth Engine канала GIS Analysis
Комментарии отсутствуют
Информация о видео
12 ноября 2023 г. 0:29:36
00:11:02
Другие видео канала