- Популярные видео
- Авто
- Видео-блоги
- ДТП, аварии
- Для маленьких
- Еда, напитки
- Животные
- Закон и право
- Знаменитости
- Игры
- Искусство
- Комедии
- Красота, мода
- Кулинария, рецепты
- Люди
- Мото
- Музыка
- Мультфильмы
- Наука, технологии
- Новости
- Образование
- Политика
- Праздники
- Приколы
- Природа
- Происшествия
- Путешествия
- Развлечения
- Ржач
- Семья
- Сериалы
- Спорт
- Стиль жизни
- ТВ передачи
- Танцы
- Технологии
- Товары
- Ужасы
- Фильмы
- Шоу-бизнес
- Юмор
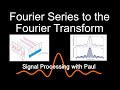
Plotting the Fourier Transform in Matlab (DFT/FFT)
#Electrical Engineering #Engineering #Signal Processing #matlab #fourierseries #fouriertransform #fourier #matlabtutorial #matlabtutorials
In this video, I'l explain how we can use Matlab to plot the (Discrete) Fourier Transform of signals. I'll explain how we can use FFTShift to rearrange the Fourier Transform so negative frequencies are on the left and positive frequencies are on the right.
Here is a link to the Live Script Notebook to follow along: https://www.dropbox.com/scl/fi/nkbn3i1jxtxti7ipotzwi/Plot_fft.mlx?rlkey=gppn102rffgk4agsyv75h8f6f&dl=0
Видео Plotting the Fourier Transform in Matlab (DFT/FFT) канала Signal Processing with Paul
Комментарии отсутствуют
Информация о видео
21 ноября 2023 г. 1:35:50
00:11:13
Другие видео канала


![Probability Theory Example [Statistical Signal Processing]](https://i.ytimg.com/vi/MAOTeOwgS0c/default.jpg)


![Expected Value of a Random Variable [Statistical Signal Processing]](https://i.ytimg.com/vi/6hAefxYkDdg/default.jpg)

![The Best Way to Create an Event System in Unity [Free Example Download]](https://i.ytimg.com/vi/oJQ_5PX83TE/default.jpg)
![Random Variables [Statistical Signal Processing]](https://i.ytimg.com/vi/Q-hjvyynXdo/default.jpg)

![Probability Theory Basics [Statistical Signal Processing]](https://i.ytimg.com/vi/PNBQBCiVO3Q/default.jpg)