Decoding the Doji Pattern
Join us in this video as we break down the Doji Pattern, a vital candlestick formation for recognizing market reversals and moments of indecision. The Doji represents a balance between bulls and bears, often signaling a potential shift in trend direction. Discover how to interpret the Doji's distinctive appearance - an open and close at nearly the same price with upper and lower wicks.
Scanner link - https://bit.ly/46ZBC7s
Видео Decoding the Doji Pattern канала Streak
Scanner link - https://bit.ly/46ZBC7s
Видео Decoding the Doji Pattern канала Streak
Показать
Комментарии отсутствуют
Информация о видео
Другие видео канала
 The Science of Charting and Candlesticks: Analyzing Market Behavior
 Best Practice & Challenges in Fintech | AWS Fintech Forum 2021 | Jaya Manohar
 3 Days High Breakout Options Strategy Backtesting
 Best Practice & Challenges in Fintech | AWS Fintech Forum 2021
 Backtesting an Options Strategy using Pivot Points Indicator
 What is a Bearish Engulfing Candlestick Pattern?
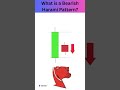 Decoding the Bearish Harami Pattern
 Backtesting Options Strategy using Opening Range Breakout
 Spotting Market Tops with Bearish RSI Divergence
 Backtesting Options Strategy with Moving Average Crossovers
 Creating and Backtesting a Short Strangle Strategy using India VIX Index
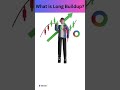 Unlocking Long Build-Up
 Understanding the Bullish Harami Pattern
 Trading with Greeks on Streak - Part 3: Delta | Streak Webinar in Hindi
 Options Trading Strategy using RSI Indicator | Tutorial
 Options Trading Strategy using MACD Indicator
 Backtesting Short Strangle using Choppiness Index
 Aroon Indicator: A 2-Minute Guide on Streak
 Intraday Momentum Index: A 2-Minute Guide on Streak
 What is Long Unwinding?
 Buying Low and Selling High- The Art of Trading Overbought and Oversold