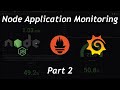
Node Application Monitoring with cAdvisor Prometheus and Grafana | part 1
0:00 Intro
0:44 Recap of express tutorial
1:40 Creating a Dockerfile for the Node server
3:17 Creating a docker-compose.yml file
5:04 Defining cAdvisor container
7:58 Defining Prometheus container with configs
11:27 Exploring Prometheus dashboard
14:18 Defining Grafana container
22:07 Exploring Grafana dashboard
25:00 Creating a default dashboard in Grafana
Previous Node tutorial: https://www.youtube.com/watch?v=H4c6woZbPKo
Видео Node Application Monitoring with cAdvisor Prometheus and Grafana | part 1 канала evan ugarte
Комментарии отсутствуют
Информация о видео
16 февраля 2022 г. 10:21:28
00:27:39
Другие видео канала


![Knxwledge - [BONUS]eggwhites. WT.PRT10.8_](https://i.ytimg.com/vi/DDG3upgDHuI/default.jpg)