TRADED MACD DIVERGENCE 100 TIMES (REVEALING PROFITS)
i backtested the MACD divergence 100 times
What is a Divergence? We all know that the MACD is an indicator that is based on trend and momentum , usually when a price is on an uptrend and have a strong komentum, the MACD is also heading in an upwards direction, and when the price is on a downtrend while having strong downwards momentum, the MACD is also heading Downwards, but there are instances where the price is indicating an uptrend, and forming higher highs, however the indicator is actually heading downwards and forms lower lows instead,this is called a DIVERGENCE,it is when the price of an asset is moving in the opposite direction of a technical indicator.
**************
📈 Download the Excel Sheet i used for backtesting -
https://drive.google.com/drive/u/3/folders/1tk4JEpz_vl6TLdPFMjvn868hXM1qGPSf
Видео TRADED MACD DIVERGENCE 100 TIMES (REVEALING PROFITS) канала Data Trader
Показать
Комментарии отсутствуют
Информация о видео
Другие видео канала
 Traded *NEW* IMPULSE MACD 100 TIMES (Is It Better Than A Normal MACD?)
 Best ATR Strategy for Day trading Forex (ATR indicator Tutorial)
 Divergence Trading Strategy - Step by Step Method
 MACD Divergence Strategy
 How To Trade Divergence
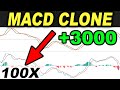 MACD CLONE 100 TIMES so you know sure thing
 Hidden Divergence. How to spot it and what it means.
 5 Simple Steps Complete Trading Strategy that PRO Traders Know but Beginners Ignore...
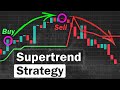 BEST Supertrend Strategy for Daytrading Forex (Settings for Supertrend Indicator)
 Easy 4 Hour Chart Trading Strategy Tested 100 Times - WAE+Kijun-Sen+SSL Indicators
 Make A Living Trading With 5 Simple Strategy Optimization Steps
 I Tested MACD Crossover Trading Strategy Indicator for X500 Times - QUANT Analysis Results Were...
 BEST William's Alligator Strategy for Daytrading Forex
 How to Actually Trade with RSI: The real Way (Including MACD and Stochastic)
 Awesome Oscillator Trading Strategy - How an Awesome Indicator can be NOT so...
 The Ultimate Trading Guide to Hidden Divergences (From Novice to Pro)
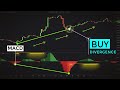 Trading MACD Divergences Like Professional Traders (Forex & Stocks Strategy)
 3 Profitable 200 Moving Average Strategies (start trading these today...)
 A RSI Divergence STRATEGY (That Actually Works...)
 Traded the MACD indicator 100 TIMES (REVEALING PROFITS)