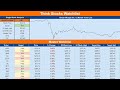
How to Calculate RSI in Google Sheets (or Excel)
RSI (Relative Strength Indicator) used by Technical traders for determining the power behind price movement, especially as it relates to being oversold or overbought. This will show you how to calculate it step by step, as well as put it in a chart.
Final Formula Shown in the Video: =IF(M18=0,100,100-(100/(1+N18)))
I'll attach a free downloadable Excel file with the post (it won't pull stock prices like Google Sheets can, but it'll have the formulas so you can use them yourself).
Get a Free Stock When You Sign Up: https://act.webull.com/kol-us/share.html?hl=en&inviteCode=hU5e8e8bmdsP
Looking for a broker to buy and sell stocks (with more customizable charts like RSI and more advanced options)? Get Free Stocks when you sign up with WeBull and deposit $100 (value up to $1,600)
In this video I cover how to make RSI, including a chart.
► Subscribe and always get the latest content!
► Find more Stock Related Content at: https://www.stocktraderjack.com
► Follow Me On Twitter: https://www.twitter.com/stocktraderjack
Advertiser Disclosure: STJ is an affiliate of Webull and may receive compensation through clicking the above (it helps me and is no cost to you). Any offers are based on the time in which the video was released and are subject to change.
Видео How to Calculate RSI in Google Sheets (or Excel) канала Stock Trader Jack
Показать
Комментарии отсутствуют
Информация о видео
Другие видео канала
 How To Make A Stock Watchlist In Google Sheets
 How to Use the Relative Strength Index (RSI)
 Google Sheets: How to Create Your Own Stock Candlestick Chart (Google Finance Beginner Tutorial)
 How To Calculate RSI Using Excel
 Relative Strength Index (RSI) Excel Template
 30 min build an ultimate stock monitor list with Google Finance free with live data in Google Sheets
 Build Your Own Stock Portfolio Tracker On Google Sheets
 Super Easy RSI Indicator Strategy For Beginners... (Insane Results!)
 Trading RSI with Andrew Cardwell and the Wyckoff Trading Method - 2.01.19
 Build A Fully Functioning STOCK WATCHLIST With Live Data In Google Sheets
 Stock Portfolio Tracker Spreadsheet - Google Sheets Template
 How to Monitor a Relative Strength Strategy using Google Sheets
 Exponential Moving Average calculation with Crossover Buy/Sell signals on Spreadsheets- Part I
 Automated Email Stock Price Alerts With Google Sheets
 How To Get The Upcoming Dividends In Google Sheets | Creating The Best Dividend Tracker
 How to Calculate RSI in Excel
 How To Make A Google Sheets Portfolio Tracker Part 1
 How to Calculate Ichimoku Clouds in Excel
 How to Create a Stock Watchlist/Stock Screener in Google Sheets! (Step by Step)
 RSI Technical Indicator