Moving Average Trading Strategy | Technical Analysis
In this video, I will be sharing the best ways of using moving averages for the purpose of trading.
First up, let us understand, what is a moving average?
A moving average is a simple line that shows the average price of an asset over a particular period of time. This means that a 20 period moving average will show us the average price of the last 20 candles.
But, how can a moving average help us in trading? How to we interpret the moving average?
Well, a moving average is basically used to identify the trend of the market and simplify the price action of the asset.
So, if the price is trading above the moving average and the moving average is sloped upwards, we can consider the price to be in an uptrend.
Inversely, if the price is trading below the moving average and the moving average is sloped downwards we regard this as a downtrend.
A flat moving average with the price moving around it, is regarded as a sideways market.
Different moving averages will show different trends of the market.
For instance, a 200 period moving average will show us the long term trend of the market.
A 50 period moving average will show us the medium term trend of the market.
And a 20 period moving average will show us the short term trend of the market.
Now, a lot of traders like to use 2 or more moving averages to identify the trend of different terms.
For instance, here on this chart we have 3 moving averages. The 20, 50, and a 200 period moving average.
Here we see that the 20 and 50 EMA are sloped upwards and the price is above them. Hence we can say that the price is in a short term uptrend. But the price is below the 200 period EMA and the 200 EMA is sloped downwards. Hence, we can say that the long term trend is downwards. So the price is in a short term uptrend and a long term downtrend.
A lot of traders also use moving average crossovers for trade signals. For instance, if we use a 20 and 50 EMA example. A sell signal is generated when the 20 EMA crosses below the 50 EMA.
On the other hand, a buy signal is generated when the 20 EMA crosses above the 50 EMA.
The crossovers can sometimes provide good trading signals in a trending market. But, in ranging markets, crossovers can give us a lot of false signals.
Another major characteristic of the moving average is that it acts as a dynamic area of support and resistance.
This means that whenever the price is in an uptrend, the price will often find support at the moving average.
Similarly, in a downtrend, the price will often find resistance at the moving average.
We will use this particular characteristic and create 3 strategies around this concept.
We will only use the 200 period Exponential moving average for all of these strategies.
And the timeframe will be 15 minute timeframe.
Видео Moving Average Trading Strategy | Technical Analysis канала Trade Prime
Показать
Комментарии отсутствуют
Информация о видео
Другие видео канала
![Secret Trading Strategy That The Top 5% Use [ Highly Profitable Strategy ]](https://i.ytimg.com/vi/yUniYFU3aF0/default.jpg) Secret Trading Strategy That The Top 5% Use [ Highly Profitable Strategy ]
Secret Trading Strategy That The Top 5% Use [ Highly Profitable Strategy ]
 The Easiest 1-Minute Scalping Strategy: 3-EMA Trading Strategy
 Price Action Secrets That Only 5% Know | (The Ultimate Guide to Price Action Trading)
 MOST EFFECTIVE VWAP Trading Strategy For Day Trading Forex And Stock Market (For Beginners)
 86% Win Rate Highly Profitable Secret Strategy | RSI + Secret Indicator
 Better that Moving Average | 100% High Probability TRENDLINE Trading Strategy That Works.
 Top 5 MOST POWERFUL Trading Indicators Every Trader Must Know
 138% Profit - 2% Per Trade - Complete Strategy
 The Only Chart Pattern Trading Video That You Will Ever Need (Technical Analysis) | FULL COURSE
 The Only Moving Average Trading Video You Will Ever Need...
 TOP 11 Moving Average SECRETS (TRUTH EXPOSED!)
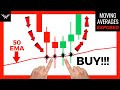 Best Moving Average Trading Strategy (MUST KNOW)
 🔴 SUPER SCALPING | 5-Minute EMA Stochastic SCALPING Strategy For Day Trading (High Winrate Strategy)
 Simple Pullback Trading Strategy (MUST WATCH)
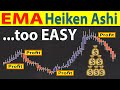 🔴 EMA-Heiken Ashi | This is The Trading Strategy The Top 5% Use (and it makes trading way too EASY!)
![How To Combine Trading Indicators For HUGE PROFITS [ Combine Indicators Like A PRO ]](https://i.ytimg.com/vi/BwBAuc-2OFY/default.jpg) How To Combine Trading Indicators For HUGE PROFITS [ Combine Indicators Like A PRO ]
How To Combine Trading Indicators For HUGE PROFITS [ Combine Indicators Like A PRO ] SIMPLE DAY TRADE STRATEGY 10 & 20 EMA = Easy High Profit
 BEST Moving Average Strategy For Daytrading Forex (SECRET METHOD) ( Moving Average Explained )
 BEST MACD Trading Strategy For Day Trading Forex and Stocks | MACD Guide For Beginners