Introduction to Visualizing Geospatial Data with Python GeoPandas
In this tutorial, you will learn how to do basic plots of geospatial data using Geopandas and Matplotlib Python libraries.
Download the exercise files - https://drive.google.com/open?id=1C_Zx4r-zRyc_9mNJ0XFZM4CDKuvtITaW
Tutorial on how to install Python and Configure Pandas (and Spyder IDE) - https://www.youtube.com/watch?v=YO6QgvgOz6U&t=198s
How to install GeoPandas (quick and easy) - https://youtu.be/310Es1ERf1M
Matplotlib Colormaps - https://matplotlib.org/users/colormaps.html
⭐NOTE:
‘Kite’ is an excellent tool that can help you boost your productivity when it comes to programming with its free Artificial Intelligence (AI) powered coding assistant. Kite is a plugin which provides smart completions and documentation as you’re typing-in your code, and its compatible with most of the well-known IDEs such as PyCharm, Spyder and VS Code. I absolutely love it, and recommend you guys to try it out as well.
https://www.kite.com/get-kite/?utm_medium=referral&utm_source=youtube&utm_campaign=geodelta&utm_content=description-only
Видео Introduction to Visualizing Geospatial Data with Python GeoPandas канала GeoDelta Labs
Показать
Комментарии отсутствуют
Информация о видео
Другие видео канала
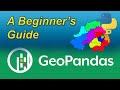 An Absolute Beginner's Guide to Python GeoPandas
 Object Oriented Programming with Python - Full Course for Beginners
 Introduction to Geospatial Data Analysis with Python | SciPy 2018 Tutorial | Serge Rey
 How to Convert Coordinates from CSV to ESRI Shapefile
 Geospatial data analysis and visualization in Python (Halfdan Rump) - PyCon JP 2017
 Downloading Topographic Maps using Google Earth
 Introduction to Dash Plotly - Data Visualization in Python
 How to download chrips Data
 Plotting Choropleth Maps using Python (Plotly)
 10 Geoprocessing Applications of GeoPandas Library
 Visualizing Graphs in Python With pyvis | Graph Theory With Python #3
 201 - Working with geotiff files using rasterio in python (also quick demo of NDVI calculation)
 Mapping the Coronavirus Cases in 2020 using Python GeoPandas and ArcGIS
 Blender Tutorial - Animating With Python, UNLOCK the power!
 Calculating Zonal Statistics of a Raster using Python
 Introduction to GIS Analysis with GeoPandas using Python
 Spatial Data Science with Python - Install Geopandas, Geemap & JupyterLab for Interactive Mapping
 Christopher Roach | Visualizing Geographic Data With Python
 Python Tutorial: Geospatial data