- Популярные видео
- Авто
- Видео-блоги
- ДТП, аварии
- Для маленьких
- Еда, напитки
- Животные
- Закон и право
- Знаменитости
- Игры
- Искусство
- Комедии
- Красота, мода
- Кулинария, рецепты
- Люди
- Мото
- Музыка
- Мультфильмы
- Наука, технологии
- Новости
- Образование
- Политика
- Праздники
- Приколы
- Природа
- Происшествия
- Путешествия
- Развлечения
- Ржач
- Семья
- Сериалы
- Спорт
- Стиль жизни
- ТВ передачи
- Танцы
- Технологии
- Товары
- Ужасы
- Фильмы
- Шоу-бизнес
- Юмор
Implementing Custom Metrics Gathering Using BPF Ring Buffers
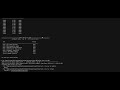
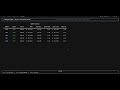
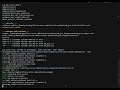
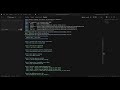
Before BPF_MAP_TYPE_RINGBUF, you streamed events from kernel to userspace through perf_event_array — one ring buffer per CPU, each consuming its full allocation whether that CPU was idle or saturated. On a 96-core machine with 4MB per-CPU buffers, that is 384MB of pinned kernel memory before your tracer logs a single event. Worse, events from different CPUs arrived out of timestamp order, so any analysis requiring causality needed a reorder pass in userspace. And if your userspace consumer stalled for even a millisecond, a busy CPU could silently overwrite the oldest records with no indication that data was lost.
Видео Implementing Custom Metrics Gathering Using BPF Ring Buffers канала SystemDRHandsOnCourseDemo
Видео Implementing Custom Metrics Gathering Using BPF Ring Buffers канала SystemDRHandsOnCourseDemo
Комментарии отсутствуют
Информация о видео
9 мая 2026 г. 16:27:51
00:01:56
Другие видео канала