Running Basic Statistical Analysis in R
R is one of the most popular tools for statistical analysis, it is also one of the few open source tools available in the market. Unlike other tools like SPSS, R uses a command line interface and could be scary for people new to the platform. However, running test in R is actually surprisingly easy and most basic analysis can be completed with a single function. In this video, I will try to run through the basic and please do let me know if you having some issues on your side.
Link to Self Checking Questions
https://forms.gle/A3GP8A61JvUP1TJaA
Link to google slide: http://bit.ly/Brandon_Yeo
VIdeo on basic plotting: https://youtu.be/Et265VzE1Tw
Video on ggplot2 - https://youtu.be/TgyWeKoK1HA
Video on gganimate - https://youtu.be/ccuZYgcwusU
Video on Data Studio - https://youtu.be/GMEaEnKk4XQ
R logo
Hadley Wickham and others at RStudio(2016),R_logo @https://commons.wikimedia.org/wiki/File:R_logo.svg
Email: liquidbrain.r@gmail.com
Github: https://github.com/brandonyph
Twitter: https://twitter.com/Brandon_yeoph
Видео Running Basic Statistical Analysis in R канала Liquid Brain
Показать
Комментарии отсутствуют
Информация о видео
Другие видео канала
 R Programming for Beginners | Complete Tutorial | R & RStudio
 Descriptive Statistics in R
 20 R Packages You Should Know (in 2021)
 Create your own PRODUCTIVITY tracker app for FREE | Appsheet Tutorial
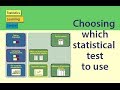 Statistical Tests: Choosing which statistical test to use
 This is How Easy It Is to Lie With Statistics
 Why Python is huge in finance? by Daniel Roos
 Statistics made easy ! ! ! Learn about the t-test, the chi square test, the p value and more
 Understanding Predictive Modeling with R
 R Programming Tutorial - Learn the Basics of Statistical Computing
 Summarized Experiment (se) Object from Bioconductor
 R vs Python | Which is Better for Data Analysis?
 Make Beautiful Graphs in R: 5 Quick Ways to Improve ggplot2 Graphs
 Multivariate Statistical Analysis Part I: Introduction and Mean Comparison (with R demonstration)
 RStudio Tips and Tricks
 R and the Tidyverse: next steps
 Introduction to Data Science with R - Data Analysis Part 1
 RNASeq Analysis | Differential Expressed Genes (DEGs) from FastQ
 Making Functions in R
 SPSS Tutorial for data analysis | SPSS for Beginners