Visualization of Complex Functions in 3D
Given X = x1 + i x2 and Y = y1 + i y2,
given a complex function Y = Y(X), this is a 1D manifold in C^2~(X,Y), or a 2D manifold in R^4~(x1,x2,y1,y2), which means a 4D surface.
Elsewhere we show these 4D visualizations.
Here we show 3D functions z = z(X) relating to Y = Y(X).
Four such functions for each Y:
z = Re(Y), z = Im(Y), z = arg(Y), and z = |Y| .
More at my webpage http://www.wugi.be/qbComplex.html .
Graphing tool: Graphing Calculator 4.0
Music: Bach, contrapunctus 19 (14). It is stopped just where Bach introduces his signature-theme: if I'd tried it on purpose it wouldn't have worked out that nice :-o)
Видео Visualization of Complex Functions in 3D канала Guido Wugi
Показать
Комментарии отсутствуют
Информация о видео
Другие видео канала
 Wugi's 4D world - The 3-sphere and its equator and poles... if any :)
 Wugi's SRT world: Light Clock demo (VB program)
 Wugi's SRT world: Twin Paradox graphs as you haven't seen them yet (2)
 Wugi's SRT world: Twin Paradox graphs as you haven't seen them yet
 Wugi's Special Relativity demos: the Rivet & Hole paradox (2)
 Wugi's Special Relativity demos: the Rivet & Hole paradox
 Wugi's Complex Functions 4D space: "Square Hyperbola" w = 1/z^2
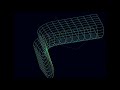 Wugi's 4D world: Why is the Clifford torus flat? (2)
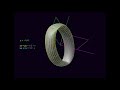 Wugi's 4D world: Why is the Clifford torus flat?
 Wugi's 4D world- The 3-sphere and its bestiary- Part 3: the Hopf fibration
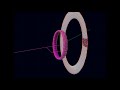 Wugi's 4D world- The 3-sphere and its bestiary- Part 2: Stereographic projection and Dupin cyclides
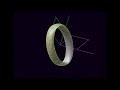 Wugi's 4D world - The 3-sphere and its bestiary - Part 1: the Clifford torus
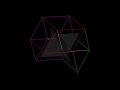 Tesseract 4D rotations
 Tesseract and its border cubes
 wugi's 4D visuals: Rotation in 4D
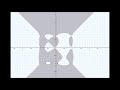 Curves defined by N points
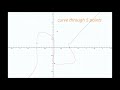 Curves defined by and going through n points
 Wugi's Complex function graphs: Quadratic Equation Roots
 Wugi's Complex Function graphs: an album. Where math meets art.
 Wugi's Complex function graphs: Circle-Hyperbola (bis)
 Wugi's music: sonatina Nr. 3 in C