How to Calculate Probability Value (P-Value) in Excel | P-Value in Statistical Hypothesis Tests
In this tutorial, you will learn how to Calculate P Value in Excel.
The p-value, short for probability value, is an important concept in statistical hypothesis testing.
It’s used in hypothesis testing to quantify the idea of statistical significance of evidence.
By running T-Test in excel, we can actually arrive at the statement whether the null hypothesis is TRUE or FALSE. Look at the below example to understand the concept practically.
We’ll be working on a hypothetical weigh loss process. First thing we need to do is calculate the difference between before diet and after diet.
Once we have the formula applied for every cell, go to Data tab and under it click on Data Analysis.
Find T.Test: Paired Two Sample for Means. Select variable range 1 and variable range 2. Leave alpha value at 0.05. Now select the Output Range, i.e., where you want to display your analysis results.
Click OK. Now let’s select the results cells for One Tail and Two Tail and click the percentage under Home tab. Add decimals if needed.
On the results, we can see that the p-value with the one-tail test is 0.64% and the p-value with the two-tail test is 1.28%.
Both results show that the p-value is lower than 5%, which means the null hypothesis is significant.
This may seem confusing at once but should be straightforward once you familiarize yourself with Excel.
❓💬 What other excel tutorials would you like us to make? Let us know in the comments below.
#HowTech #Excel
--------------------------------------------------------------------------------------------------------------
✅ All our announcements are available here https://t.me/howtechtv
✅ Commercial questions info@howtech.tv
✅ Facebook https://www.facebook.com/howtechtv
✅ Instagram https://www.instagram.com/howtechprojects
✅ Twitter https://twitter.com/howtechprojects
Видео How to Calculate Probability Value (P-Value) in Excel | P-Value in Statistical Hypothesis Tests канала Excel, Word and PowerPoint Tutorials from Howtech
Показать
Комментарии отсутствуют
Информация о видео
3 июня 2021 г. 17:00:14
00:02:10
Другие видео канала
 How to calculate Pearson correlation coefficient and p-value in excel
 How To Perform A One-Sample T-Test In Excel
 How We’re Fooled By Statistics
 Perform A Two-Sample F Test In Excel (Variance Test)
![Calculate q-value from p-value in Excel [with subtitles!]](https://i.ytimg.com/vi/_I6S-NTGRA4/default.jpg) Calculate q-value from p-value in Excel [with subtitles!]
Calculate q-value from p-value in Excel [with subtitles!]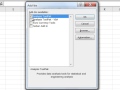 How to Install the Data Analysis ToolPak in Microsoft Excel
 How to find critical values for a hypothesis test using a z or t table
 What is P Value? In a Simple and Easy way by G N Satish Kumar
 How to calculate One Tail and Two Tail Tests For Hypothesis Testing.
 The Riemann Hypothesis, Explained
 Using Excel to calculate a correlation coefficient || interpret relationship between variables
 CIS-200 - Chi-Square of a Likert Scale in Excel
 Statistics 101: Logistic Regression Probability, Odds, and Odds Ratio
 How to Find P-Value in Excel
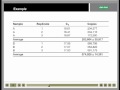 Real Time QPCR Data Analysis Tutorial
 Type I error vs Type II error
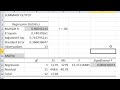 How to Calculate a Correlation (and P-Value) in Microsoft Excel
 Riemann Hypothesis - Numberphile
 Performing a t-test in GraphPad Prism
 Calculate Percentages in Excel | Calculate a Percentage as Proportion | Calculate Percentage Change