- Популярные видео
- Авто
- Видео-блоги
- ДТП, аварии
- Для маленьких
- Еда, напитки
- Животные
- Закон и право
- Знаменитости
- Игры
- Искусство
- Комедии
- Красота, мода
- Кулинария, рецепты
- Люди
- Мото
- Музыка
- Мультфильмы
- Наука, технологии
- Новости
- Образование
- Политика
- Праздники
- Приколы
- Природа
- Происшествия
- Путешествия
- Развлечения
- Ржач
- Семья
- Сериалы
- Спорт
- Стиль жизни
- ТВ передачи
- Танцы
- Технологии
- Товары
- Ужасы
- Фильмы
- Шоу-бизнес
- Юмор
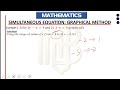
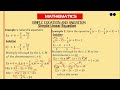
GRAPHICAL REPRESENTATION OF INEQUALITIES INVOLVING TWO VARIABLES 1
Struggling to understand inequalities involving two variables? This video makes it simple and visual!
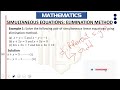
In this lesson, you will learn how to graph linear inequalities on the Cartesian plane, identify the boundary line, and correctly shade the required region depending on the inequality signs.
✨ In this video, you’ll learn:
✔️ How to draw the boundary line
✔️ When to use a dashed or solid line
✔️ How to know the correct region to shade
✔️ The difference between “less than” and “greater than” inequalities
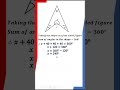
✔️ Easy step-by-step examples for beginners
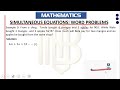
Whether you are preparing for WAEC, NECO, JAMB, GCSE, or simply improving your Mathematics skills, this tutorial will help you understand graphical inequalities with ease.
📌 Don’t forget to: 👍 Like the video
💬 Leave a comment
🔔 Subscribe to MathisBliss for more simplified Mathematics lessons
#Mathematics #GraphicalInequalities #LinearInequalities #MathisBliss #Algebra #Graphing #WAEC #NECO #JAMB #MathTutorial
Видео GRAPHICAL REPRESENTATION OF INEQUALITIES INVOLVING TWO VARIABLES 1 канала MATH IS BLISS (MIB)
In this lesson, you will learn how to graph linear inequalities on the Cartesian plane, identify the boundary line, and correctly shade the required region depending on the inequality signs.
✨ In this video, you’ll learn:
✔️ How to draw the boundary line
✔️ When to use a dashed or solid line
✔️ How to know the correct region to shade
✔️ The difference between “less than” and “greater than” inequalities
✔️ Easy step-by-step examples for beginners
Whether you are preparing for WAEC, NECO, JAMB, GCSE, or simply improving your Mathematics skills, this tutorial will help you understand graphical inequalities with ease.
📌 Don’t forget to: 👍 Like the video
💬 Leave a comment
🔔 Subscribe to MathisBliss for more simplified Mathematics lessons
#Mathematics #GraphicalInequalities #LinearInequalities #MathisBliss #Algebra #Graphing #WAEC #NECO #JAMB #MathTutorial
Видео GRAPHICAL REPRESENTATION OF INEQUALITIES INVOLVING TWO VARIABLES 1 канала MATH IS BLISS (MIB)
Комментарии отсутствуют
Информация о видео
20 мая 2026 г. 20:20:09
00:03:23
Другие видео канала