How to Create Metrics Line Graph Analytics Vector Artwork in Illustrator
BEAUTIFUL COLOR AND BLENDING | Create a Simple Graph Chart | Use Beautiful Colors and Gradients
You’re going to love using the Curvature Tool and the Blend Tool to create these beautiful line graphs!
🎯 Subscribe for Daily Tutorials → https://goo.gl/DN4Nln
💰 Buy the Photoshop Course and Support the Channel → http://bit.ly/28NuwFy
🔥 ↓ VIDEO GUIDE ↓ 🔥
00:35 Getting started
01:27 Creating the layers and shapes we need to start
02:35 Creating the graph lines quickly
05:06 Creating the graph numbers
09:19 Creating a masked layer
11:39 Introducing the Curvature Tool
12:32 Adding the first gradient
13:22 Creating the color blend
15:50 Creating a second graph line
18:34 Adding some contrast/transparency
19:05 Playing with the blends to tweak the whole effect
20:42 Final thoughts
In this Adobe Illustrator tutorial, we’ll build a simple colorful analytics dashboard style line graph with a blended gradient that fades in and out based upon the curve in the line chart. We’ll use the Grid tool, the Curvature tool, Gradients, the Curvature tool, Direct Selection, and Opacity changes to create a beautiful and colorful dynamic effect.
⚡️ written tutorial: http://bit.ly/2jMTZrC
INSTAGRAM: http://instagram.com/tutvid
TWITTER: http://twitter.com/tutvid
FACEBOOK: https://www.facebook.com/tutvid
SNAPCHAT: tutvid.com
tutvid is a YouTube channel dedicated to creating the best Adobe Photoshop, Premiere Pro, Lightroom, and Illustrator tutorials. My goal is to create the best, most informative, and entertaining tutorials on the web. If you enjoy my videos, the best way to support what I do here is to purchase my course linked above or simply subscribe to the YouTube channel by pressing the red button.
✉️ business inquiries: nate@tutvid.com
–
CREDITS:
Social Icons in outro: http://www.freepik.com/free-vector/six-social-networking-icons-with-infographic-resources_982300.htm
Видео How to Create Metrics Line Graph Analytics Vector Artwork in Illustrator канала tutvid
Показать
Комментарии отсутствуют
Информация о видео
Другие видео канала
 Incredible 3D Dots and Lines Glowing Fiber Effect in Illustrator
 How to Make Vector Abstract Particles Using Adobe Illustrator
 Blending Vector Art - Adobe Illustrator/Photoshop
 Geometric Line Art Tutorial | Adobe Illustrator
 Illustrator CC 2019 in Hindi: Column Graph, Stacked Column Graph, Bar Graph Tool #16
 AI大数据可视化图形设计 | Adobe illustrator tutorial big data visualization
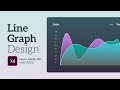 Adobe XD tutorial | How to create a line graph!
 Make a Radial Bar Graph in Adobe Illustrator keeping data live
 Adobe Illustrator: Creating Graphs in Adobe Illustrator using Excel Data
 Fantasy Vector Artwork in Adobe Illustrator | Speed Art
 Wave Text Effect in Adobe Illustrator | Make with Mesh & Transform | Graphic design
 Low Poly Thumbs Up Icon | Adobe Illustrator Tutorial
 10 Essential Design Tips for Illustrator
 How to Create 3D Pie Graph Chart in Adobe Illustrator
 Enhance Illustrator Charts and Graphs ft. Jason Hoppe // CreativePro Live
 Isometric Diagrams with Rhino Illustrator Photoshop - Easy Tips for Nice Graphics
 Learn how to add charts, graphs to an infographic layout in Adobe InDesign
 Negative Space Logos: SECRETS - THEORIES - TECHNIQUES
 Warp Text To 3D Shapes in Adobe Illustrator | Graphic design
 Glass Planet Vector Illustration – Adobe Illustrator Tutorial