R Stats: Multiple Regression - Variable Selection
This video gives a quick overview of constructing a multiple regression model using R to estimate vehicles price based on their characteristics. The video focuses on how to employ a method of improving a linear model, and thus its linear equation, by stepwise regression with backward elimination of variables. It will demonstrate the process of building a model by starting with all candidate predictors and eliminating them one by one to optimize the model. The lesson also explains how to guide this optimization process by relying on the measures of model quality, such as R-Squared and Adjusted R-Squared statistics, and how to assess the variables usefulness to the model by judging their p-values, which represent the confidence in their coefficients which are to be used in the linear equation. The final model will be evaluated by calculating the correlation between the predicted and actual vehicle price for both the training and validation data sets. The explanation will be quite informal and will avoid the more complex statistical concepts. Note that a more complex process of building a multiple linear model, with details of variables transformation, checking for their multiple collinearity and extreme values, will be explained in the next lesson.
The data for this lesson can be obtained from the well-known UCI Machine Learning archives:
* https://archive.ics.uci.edu/ml/datasets/automobile
The R source code for this video can be found here (some small discrepancies are possible):
* http://visanalytics.org/youtube-rsrc/r-stats/Demo-D1-Multiple-Reg-Var-Selection.r
Videos in data analytics and data visualization by Jacob Cybulski, visanalytics.org.
Видео R Stats: Multiple Regression - Variable Selection канала ironfrown
Показать
Комментарии отсутствуют
Информация о видео
Другие видео канала
 R Stats: Multiple Regression - Variable Preparation
 Variable selection procedures in R: Forward, backward, stepwise, and best-subsets regression (2020)
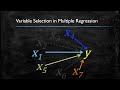 Video 6: Variable Selection
 Multiple Linear Regression with Interaction in R | R Tutorial 5.9 | MarinStatsLectures
 Interpreting Linear Regression Output in R
 Regression Output Explained
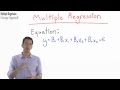 Stats 35 Multiple Regression
 Multiple Regression in R, Step-by-Step!!!
 Nonparametric Kernel regression
 Bayes theorem, the geometry of changing beliefs
 Building a Regression Model with Matlab – Machine Learning for Engineers
 Stepwise Regression
 Correlation in R
 Multiple Linear Regression in R
 Logistic Regression in R, Clearly Explained!!!!
 Lecture46 (Data2Decision) Best Subset Regression in R
 Correlation Matrix in R
 StatQuest: Random Forests in R
 Fernando Miguez (Part 2) Nonlinear (mixed) models
 R for Biologists: Your First Plot