Learn How to Graph the Cosine Function with a Phase Shift
Learn how to graph a cosine function. To graph a cosine function, we first determine the amplitude (the maximum point on the graph), the period (the distance/time for a complete oscillation), the phase shift (the horizontal shift from the parent function), the vertical shift (the vertical shift from the parent function) and the x-scale (the distance between the turns and the x-intercepts). After we have obtained these features, we plot the points on the graph and graph accordingly.
Subscribe: https://www.youtube.com/user/mrbrianmclogan?sub_confirmation=1
Website: http://www.freemathvideos.com
Learn from Udemy: https://www.udemy.com/user/brianmclogan2/
Follow me on
Facebook: https://www.facebook.com/freemathvideos/
Twitter https://twitter.com/mrbrianmclogan
#graphtrig
#trigonometry #graphtrigfunctions
#trigonometry #graphtrigfunctions
Видео Learn How to Graph the Cosine Function with a Phase Shift канала Brian McLogan
Показать
Комментарии отсутствуют
Информация о видео
Другие видео канала
 How To Graph Sine & Cosine Functions Using Transformations, Phase Shifts, Amplitude & Period
 How to Graph Tangent with a Horizontal Shift to the Right
 How to find the reference angle | 16 Examples
 Graphing a Cosine Function with a Horizontal Translation
 Graph the Secant Function with a Phase Shift of pi Halves
 Graphing Cotangent with a Phase Shift and Vertical Translation
 Graphing the Cosine Function with a Phase Shift
 Learn How to Graph Cosine with a Vertical Translation
 Graphing the Cosine Graph with Multiple Transformations
 Learning to Graph the Sine Function with Transformations
 Find the reference angle and sketch both angles in standard position
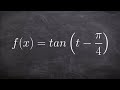 Graphing the Tangent Functions with a Phase Shift
 How to determine the equation of a COSINE graph
![Graphing the Cosine (cos) Function [fbt]](https://i.ytimg.com/vi/5-Xt_HEQ1nw/default.jpg) Graphing the Cosine (cos) Function [fbt]
Graphing the Cosine (cos) Function [fbt] What are the critical points of a sine and cosine graph
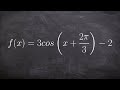 How to Graph the Cosine Graph with Multiple Transformations
 Amplitude, Phase shift, Vertical Shift, and Period change of the Cosine Function
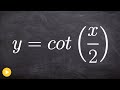 Learn How to Graph Cotangent
 Graphing the Cosine Graph with Vertical Shift