[Visual] The Riemann Zeta Function Visualised
Three different visuals exploring the Riemann Zeta function (without commentary). The 3rd visual shows shows a large part of the critical strip. These visuals are "3D phase portraits" or "modular surfaces" (not to be confused with modular functions or forms). The input is the complex plane, shown as the silver base plate. The output is the surface. The height of the surface is the absolute value of the Riemann Zeta function. The colour is the argument, or polar angle, of the Riemann Zeta function.
The zeros are where the surface touches the ground plate. (sometimes there is the slightest gap, because the mesh doesn't have a vertex perfectly on the zero.) On the real axis there are the trivial zeros which are easily calculated. Next to the imaginary axis at Re(ζ) = 0.5, are the "Million Dollar Zeros". (There is a 1 million prize available if you can prove they only appear at Re(ζ) = 0.5. The Riemann Hypothesis).
In this video:
0:00 Riemann Zeta Function.
1:36 Riemann Zeta Function. Height = log(1+|ζ|)
3:13 The Critical Strip of the Riemann Zeta Function
The 2nd visual uses the log function to control the height.
The 3rd visual shows only the critical strip (Re(ζ) between 0 and 1) . It is known that all the million dollar zeros are within this strip. To date, they have only be found at Re(ζ)=0.5
Sorry my camera-work is a little wonky. I'll try to improve it. I just couldn't bring myself to re-render this. Ray-tracing this took some CPU & GPU cycles! Rendered with Blender.
Видео [Visual] The Riemann Zeta Function Visualised канала The Mathemagicians' Guild
Показать
Комментарии отсутствуют
Информация о видео
10 января 2021 г. 2:00:44
00:08:41
Другие видео канала
 The Key to the Riemann Hypothesis - Numberphile
 Factorials, prime numbers, and the Riemann Hypothesis
 Introduction to Complex Numbers - Complex Analysis #1
 Why is pi here? And why is it squared? A geometric answer to the Basel problem
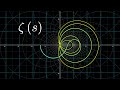 Visualizing the Riemann zeta function and analytic continuation
 Grant Sanderson (3Blue1Brown): Euler Product Formula and the Riemann Zeta-Function
 The Riemann Hypothesis, Explained
 A (very) Brief History of Bernhard Riemann
 What is the Riemann Hypothesis?
 Some identities involving the Riemann-Zeta function.
 Analytic Continuation and the Zeta Function
 Euler’s Pi Prime Product and Riemann’s Zeta Function
 The Mandelbrot Set Explained
 The Pattern to Prime Numbers?
![[Visual] Modular Form - Level 1 Weight 12 (Ramanujan Delta Function)](https://i.ytimg.com/vi/s6sdEbGNdic/default.jpg) [Visual] Modular Form - Level 1 Weight 12 (Ramanujan Delta Function)
[Visual] Modular Form - Level 1 Weight 12 (Ramanujan Delta Function) "Les mystères de la fonction zêta de Riemann" par Antoine Chambert-Loir
 Exploring the Riemann Zeta Function and the Riemann Hypothesis
 What is the Riemann Hypothesis, and why does it matter? by Prof. Ken Ono
 Riemann Hypothesis
 Mandelbrot set, Julia set, both fractals or neither