Mean, Median & Mode Robustness, Standard Deviation, Skewed Right Positive Skew Skewed left
http://www.stomponstep1.com/standard-deviation-mean-median-mode-robustness/
SKIP AHEAD:
0:53 - Mean
1:46 – Median
2:30 – Mode
2:57 – Robustness
4:16 – Skewed Histograms
5:28 – Standard Deviation
ERRATA: The Mean of 1+3+3+5+7+10+100 is 18.43, NOT 22 like I mentioned in the video. (1+3+3+5+7+10+100) / 7 = 18.43. The text below has been corrected and a note has been added to the appropriate point in the video
3 Measures of Central Tendency
• Mean (average) = The sum of all of the values divided by the number of values. Least Robust
• Median ("middle" value) = The value that is in the middle when all of the values are arranged in ascending order. If there is an even number of values there is no single middle value. Therefore, you take the average of the two middle value. Robustness is in between mean and mode
• Mode (most common value) = The value that appears the highest number of times. Most Robust
If you are given the list of values 1, 3, 3, 5, 7, 10. What is the mean, median, and mode?
Mean = (1+3+3+5+7+10) _ 6 = 4.83
Median = average of the 2 middle values since there is an even number of values. (3+5)_ 2 = 4
Mode = most frequent value = 3
If you take the list of values from the previous question but now add an additional value of 100 how does the mean, median, and mode change?
Mean = (1+3+3+5+7+10+100) / 7 = 18.43
Median = middle value = 5
Mode = most frequent value = 3
The above question illustrates how Robust, or resistant to change by an extreme value, the three measures of central tendency are. You can see that by adding one extreme value (an outlier) the mean has changed a lot and mode hasn't changed at all. This is because mean is the least robust of the three values and mode is the most robust. Median is less robust than mode, but more robust than mean.
On Step 1 you may also be asked to compare mean, median, and mode in certain situations based on a histogram or set of values. For example, the answer looks like "mean is greater than mode" rather than a precise numerical answer. In most of these cases the data is skewed significantly in one direction and is not normally distributed.
Normal Distribution, Normally Distributed, Skewed Right, Skewed Left, Positive Skew, Negative Skew, Negatively Skewed, Positively Skewed
Standard deviation (greek symbol σ) measures how much the values in a data set differs from the mean. In other words, standard deviation measures dispersion or variability in a set of values. A data set with mostly similar values has a small standard deviation, while a data set with very different values has a large standard deviation.
Standard deviation changes with changes in sample size (number of values or participants). With small sample sizes random chance has a bigger impact and therefore standard deviation for a small sample size is generally larger. Studies with more values generally have smaller standard deviations as chance plays less of a role.
Видео Mean, Median & Mode Robustness, Standard Deviation, Skewed Right Positive Skew Skewed left канала Stomp On Step 1
Показать
Комментарии отсутствуют
Информация о видео
Другие видео канала
 2x2 Table False Positive False Negative True Positive True Negative for screening Tests
 Confidence Interval Interpretation. 95% Confidence Interval 90% 99%
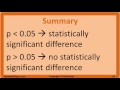 Null Hypothesis, p-Value, Statistical Significance, Type 1 Error and Type 2 Error
 Incidence & Prevalence Definition. Case-Fatality Rate Formula & Calculation
 Confounding Randomization & blinding
 Statistics 101: Binomial Mean and Standard Deviation
 Teach me STATISTICS in half an hour!
 Statistics 101: Standard Error of the Mean
 Skewness - Right, Left & Symmetric Distribution - Mean, Median, & Mode With Boxplots - Statistics
 Pharmacy Biostats - Naplex Study Questions
 Bias & Validity Definition in Research Study Design
 Odds Ratio & Relative Risk Calculation & Definition, Probability & Odds
 USMLE STEP 1: DEFENSE MECHANISM w/ Questions
 What I am learning from my white grandchildren -- truths about race | Anthony Peterson | TEDxAntioch
 Statistics 101: Confidence Interval Concepts, Sigma Unknown
 Estimate Mean and Standard Deviation from Box and Whisker Plot Normal and Right Skewed Distribution
 Lecture55 (Data2Decision) Robust Estimation
 Standard Deviation
 Number Needed to Treat, Absolute Risk Reduction, Attributable Risk, Number Needed to Harm