- Популярные видео
- Авто
- Видео-блоги
- ДТП, аварии
- Для маленьких
- Еда, напитки
- Животные
- Закон и право
- Знаменитости
- Игры
- Искусство
- Комедии
- Красота, мода
- Кулинария, рецепты
- Люди
- Мото
- Музыка
- Мультфильмы
- Наука, технологии
- Новости
- Образование
- Политика
- Праздники
- Приколы
- Природа
- Происшествия
- Путешествия
- Развлечения
- Ржач
- Семья
- Сериалы
- Спорт
- Стиль жизни
- ТВ передачи
- Танцы
- Технологии
- Товары
- Ужасы
- Фильмы
- Шоу-бизнес
- Юмор
Power BI Tooltips Tutorial | Make Your Dashboards 10X Better with Interactive Tooltips
Want to make your Power BI dashboards more interactive, insightful, and professional?
In this complete Power BI tutorial, you'll learn everything about Tooltips in Power BI, including how to create custom tooltip pages, display additional insights on hover, and improve the overall user experience of your reports.
What You'll Learn:
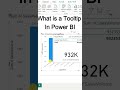
✅ What are Tooltips in Power BI?
✅ Default vs Custom Tooltips
✅ Creating Tooltip Pages
✅ Adding Visuals to Tooltips
✅ Improving Dashboard Navigation
✅ Real-World Dashboard Examples
✅ Best Practices for Professional Reports
Tooltips are one of the most underrated features in Power BI. They help users explore data without cluttering the dashboard, making reports cleaner, smarter, and more interactive.
Whether you're a beginner, data analyst, business analyst, or Power BI developer, this tutorial will help you create dashboards that stand out.
📌 Don't forget to Like, Share, and Subscribe for more Power BI, SQL, Excel, DAX, and Data Analytics tutorials.
#PowerBI #PowerBITutorial #PowerBITooltips #DashboardDesign #BusinessIntelligence #DataVisualization #PowerBITraining #DataAnalytics #MicrosoftPowerBI #DAX #PowerQuery #DataAnalyst #BIReports #LearnPowerBI #PowerBITips
Tags
Power BI Tooltips, Power BI Dashboard Design, Custom Tooltips Power BI, Power BI Tutorial, Data Visualization, Interactive Dashboards, Power BI Training, DAX, Power Query, Business Intelligence, Data Analyst, Dashboard Tips, Power BI Beginners, Microsoft Power BI, Report Design
Suggested Thumbnail Text:
"TURN YOUR DASHBOARD 10X BETTER!"
WITH POWER BI TOOLTIPS 🚀
Видео Power BI Tooltips Tutorial | Make Your Dashboards 10X Better with Interactive Tooltips канала Learn Power BI
In this complete Power BI tutorial, you'll learn everything about Tooltips in Power BI, including how to create custom tooltip pages, display additional insights on hover, and improve the overall user experience of your reports.
What You'll Learn:
✅ What are Tooltips in Power BI?
✅ Default vs Custom Tooltips
✅ Creating Tooltip Pages
✅ Adding Visuals to Tooltips
✅ Improving Dashboard Navigation
✅ Real-World Dashboard Examples
✅ Best Practices for Professional Reports
Tooltips are one of the most underrated features in Power BI. They help users explore data without cluttering the dashboard, making reports cleaner, smarter, and more interactive.
Whether you're a beginner, data analyst, business analyst, or Power BI developer, this tutorial will help you create dashboards that stand out.
📌 Don't forget to Like, Share, and Subscribe for more Power BI, SQL, Excel, DAX, and Data Analytics tutorials.
#PowerBI #PowerBITutorial #PowerBITooltips #DashboardDesign #BusinessIntelligence #DataVisualization #PowerBITraining #DataAnalytics #MicrosoftPowerBI #DAX #PowerQuery #DataAnalyst #BIReports #LearnPowerBI #PowerBITips
Tags
Power BI Tooltips, Power BI Dashboard Design, Custom Tooltips Power BI, Power BI Tutorial, Data Visualization, Interactive Dashboards, Power BI Training, DAX, Power Query, Business Intelligence, Data Analyst, Dashboard Tips, Power BI Beginners, Microsoft Power BI, Report Design
Suggested Thumbnail Text:
"TURN YOUR DASHBOARD 10X BETTER!"
WITH POWER BI TOOLTIPS 🚀
Видео Power BI Tooltips Tutorial | Make Your Dashboards 10X Better with Interactive Tooltips канала Learn Power BI
Комментарии отсутствуют
Информация о видео
13 июня 2026 г. 20:59:51
00:14:35
Другие видео канала