- Популярные видео
- Авто
- Видео-блоги
- ДТП, аварии
- Для маленьких
- Еда, напитки
- Животные
- Закон и право
- Знаменитости
- Игры
- Искусство
- Комедии
- Красота, мода
- Кулинария, рецепты
- Люди
- Мото
- Музыка
- Мультфильмы
- Наука, технологии
- Новости
- Образование
- Политика
- Праздники
- Приколы
- Природа
- Происшествия
- Путешествия
- Развлечения
- Ржач
- Семья
- Сериалы
- Спорт
- Стиль жизни
- ТВ передачи
- Танцы
- Технологии
- Товары
- Ужасы
- Фильмы
- Шоу-бизнес
- Юмор
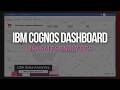
IBM Cognos Analytics Dashboard | Shoperoo Retail Sales Analysis
In this project, I designed an interactive retail sales dashboard using IBM Cognos Analytics to analyze revenue performance and business trends across multiple dimensions.
The dashboard provides key business insights using KPIs such as total revenue and planned revenue. It enables dynamic data exploration through filters including country, order year, and education level.
To present analytics effectively, I used bar and column charts to highlight top cities by revenue and customer satisfaction ratings, pie charts for revenue distribution by demographic segments, line charts to track revenue trends by product line over time, and stacked column charts to analyze quantity sold across product categories.
This project demonstrates skills in data modeling, CQL querying, dashboard visualization, and drill-down analysis in Cognos Analytics.
Github: https://github.com/IAMUZAIRMEHMOOD/Projects-IBM-Data-Analyst-Professional-Certificate-2025/tree/main/IBM%20Cognos-Project-1-Shoperoo-Retail-Sales
#uzairmehmood_se #dataanlysis #IBM #Project
Видео IBM Cognos Analytics Dashboard | Shoperoo Retail Sales Analysis канала Uzair Mehmood
iamuzairmehmood IBM Cognos Cognos Dashboard Retail Sales Dashboard Data Visualization Business Intelligence Dashboard Cognos Analytics Project Sales Analytics Retail Analytics BI Reporting Interactive Dashboard Revenue Analysis Customer Behavior Analysis Cognos Portfolio Data Analytics Project Dashboard Design
Комментарии отсутствуют
Информация о видео
3 мая 2026 г. 15:30:34
00:00:31
Другие видео канала