(Don't Call Them) Joy Plots | History of Statistics
History of the data visualization known as "joy plot".
Thanks for watching!! ❤️
// Jocelyn Bell Documentary
https://www.youtube.com/watch?v=NDW9zKqvPJI
// Peter Saville Video
https://www.youtube.com/watch?v=reEQye0EOAw#t=202
// The Nature of Pulsars
https://www.jstor.org/stable/pdf/24927701.pdf
Tip Jar 👉🏻👈🏻
☕️ https://ko-fi.com/mathetal
♫ Eric Skiff - Chibi Ninja
http://freemusicarchive.org/music/Eric_Skiff/Resistor_Anthems/eric_skiff_-_03_-_chibi_ninja
Видео (Don't Call Them) Joy Plots | History of Statistics канала math et al
Показать
Комментарии отсутствуют
Информация о видео
Другие видео канала
 Rise and Fall of the Iris Dataset | History of Statistics
 Bernstein's Equations | ABO Blood Typing Example
 Parallel Analysis in R
![[Proof] ABA^T is skew-symmetric](https://i.ytimg.com/vi/KA3E84VWD70/default.jpg) [Proof] ABA^T is skew-symmetric
[Proof] ABA^T is skew-symmetric Convolution and the Inverse Laplace Transform | Diff EQs
 GCut and Watershed | Fixing a Bad Skullstrip
 Find P(X ≥ 0.3 | Y = 0.9) | Continuous RVs
 Chi-Square Goodness of Fit Test
 Dot Density Map in R Using Census Data
 Logistic Regression
 Latin Square Design + R Demo
 Fsurf for FreeSurfer
![[FreeSurfer 6.0] Parallelizing | Multicore Recon-all](https://i.ytimg.com/vi/twF89RZD5g0/default.jpg) [FreeSurfer 6.0] Parallelizing | Multicore Recon-all
[FreeSurfer 6.0] Parallelizing | Multicore Recon-all Find k that makes f(y) a PDF | Probability and Statistics
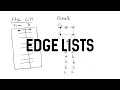 Edge List | Graph Data Structure + R Demo
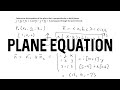 Plane Equation Perpendicular to Two Planes and Through a Point | Calculus 3
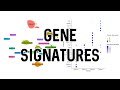 Gene Signatures Plot | scRNA-Seq Analysis in Seurat
 Find Angle Between Two Vectors | Calculus 3
![[FreeSurfer] HighField and Submillimeter Pipelines](https://i.ytimg.com/vi/BeE6HC4d9CA/default.jpg) [FreeSurfer] HighField and Submillimeter Pipelines
[FreeSurfer] HighField and Submillimeter Pipelines![Convert to PDF, Survival Function, or Hazard Ratio [Survival Analysis]](https://i.ytimg.com/vi/XLUnu5iDSuw/default.jpg) Convert to PDF, Survival Function, or Hazard Ratio [Survival Analysis]
Convert to PDF, Survival Function, or Hazard Ratio [Survival Analysis]![[FreeSurfer] Brainstem Substructures](https://i.ytimg.com/vi/2cUWspXkuCY/default.jpg) [FreeSurfer] Brainstem Substructures
[FreeSurfer] Brainstem Substructures