US Stock Market Indexes Update – S&P 500, Nasdaq, NYSE, Russell 2000 – 14 January 2024
➜ To see full length video (1hr) – which is available to Stage Analysis members only and the regular (1 hour+) weekly videos using Stan Weinstein's Stage Analysis and the Wyckoff method. Join Stage Analysis Members at: https://www.stageanalysis.net/members
Stage Analysis members weekend video discussing the Major US Stock Market Indexes, and then in the members only content – the Futures charts, Industry Groups Relative Strength (RS) Rankings, IBD Industry Group Bell Curve – Bullish Percent, the key Market Breadth Charts to determine the Weight of Evidence, Significant Weekly Bars and the most recent US watchlist stocks in detail on multiple timeframes.
=======================
Stage Analysis Website
=======================
The website content is focused around about Stan Weinstein's Stage Analysis method from his classic book: Stan Weinstein's Secrets for Profit in Bull and Bear Markets
https://www.stageanalysis.net
=======================
Follow us on Social Media:
=======================
Twitter: https://twitter.com/stageanalysis
Stocktwits: https://stocktwits.com/StageAnalysis
=======================
Subscribe to the Channel
=======================
Subscribe to the Stage Analysis Youtube Channel to get the latest stock trading videos when they are released:
https://www.youtube.com/channel/UCKzgts1fFoDla4ozJSn1eZQ?sub_confirmation=1
Disclaimer: All stock charts and ideas presented are for educational purposes only. Always do your own research before making any trades.
#stocks #trading #money #StanWeinstein #Wyckoff #nyse #nasdaq #technicalanalysis #stock #stockbreakouts #stocksandshares #investing
Видео US Stock Market Indexes Update – S&P 500, Nasdaq, NYSE, Russell 2000 – 14 January 2024 канала Stage Analysis
Показать
Комментарии отсутствуют
Информация о видео
Другие видео канала
 US Stock Market Update Plus Stocks Watchlist of Stocks Basing in Stage 2 With Breakout Potential
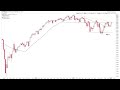 S&P 500 Stage 1 and Custom Sector Breadth Charts Analysis – 11 January 2023
 US Stocks Watchlist – TSLA, F, C, JPM – 30 June 2024
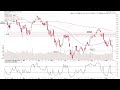 Stock Market Indexes and Stage Analysis of Stocks Close to or Attempting To Move Into Early Stage 2
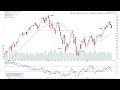 Pullback in Stage 2 in the US Indexes – $SPY, $QQQ, $IWM – 20 August 2023
 Stage 4 Breakdowns Attempts in the Mega Caps – MSFT, GOOGL, AMZN – 8 September 2024
 Spring Type Action in the Major Indexes – Stage Analysis Members Midweek Video – 4 May 2022
 Ethereum Stage 4 Breakdown Attempt – 4 August 2024
 US Stock Market Stage Analysis – S&P 500, Nasdaq 100, Nasdaq NYSE, Russell 2000 – 8 October 2023
 Breakout Stocks and Shares Watchlist - Technical Analysis of the US Stock Market 2020-01-21
 Market Breadth Update to Determine the Weight of Evidence – 11 Dec 2022
 Stage Analysis Members Video - Part 1 - 6 March 2022 - Stockmarket, Market Breadth & Group focus
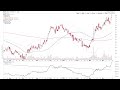 Stage Analysis Watchlist Stocks – $SILV, $AGI, $CCJ – 21 April 2024
 Software Group Focus (Part 1) – IGV, APP, PLTR, ZS – 18 October 2023
 US Stocks Watchlist – TSLA, TIGR, YOU, RXT – 9 June 2024
 US Stocks Watchlist – FSLR, TAN, ENPH, CSIQ – 28 July 2024
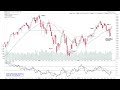 US Stock Market Indexes Update – 12 November 2023
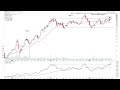 Stock Market Indexes, Market Breadth & ENPH Enphase Energy Stage 2 Breakout – 27 July 2022
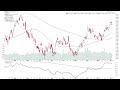 Major Indexes Update – S&P 500, Nasdaq 100, Nasdaq Composite, Russell 2000 – 5 April 2023
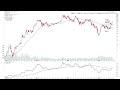 Group Focus: Automobiles –14 June 2023