Animated map: all earthquakes of the past 15 years
This animated map created from the NOAA, NWS, and PTWC shows every recorded earthquake in chronological order from January 1, 2001 to December 31, 2015. The size of the circle shows the magnitude of the earthquakes in relation to each other. The color represents the earthquake depth.
Read more: http://www.techinsider.io/
FACEBOOK: https://www.facebook.com/techinsider
TWITTER: https://twitter.com/businessinsider
INSTAGRAM: https://www.instagram.com/businessinsider/
TUMBLR: http://businessinsider.tumblr.com/
Видео Animated map: all earthquakes of the past 15 years канала Tech Insider
Показать
Комментарии отсутствуют
Информация о видео
Другие видео канала
 Animation of where the largest earthquakes of the past 100 years have struck
 Largest Earthquakes in World History - Map Timelapse
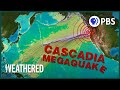 Will the Cascadia Earthquake be the Worst Disaster North America’s Ever Seen? | Weathered
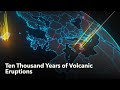 Animated Maps: Ten Thousand Years of Volcanic Eruptions
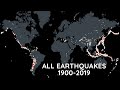 Every Earthquake (1900-2019)
 Time-Lapse of Storm in Mexico - 360 VR Video
 Arctic 360° | Guardian VR
 Plate Tectonics Explained
 What Happened On Earth In March 2018? - Tectonic Plates Problem
 VR Earthquake in 360! Education in 360 | Powers of Nature: Part 3
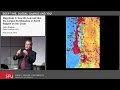 Magnitude 9: The Largest Earthquakes on Earth Happen in BC
 How To Reverse Image Search (Google)
 Earthquakemonitoring Worldmap
 5 Powerful Earthquakes Caught On Camera
 5 Massive Earthquakes Waiting To Happen
 How To Make A Car In Roblox
 Force Thirteen : Earthquakes - Ohonua ∙ Tonga ∙ Labasa ∙ Fiji ∙ Punta De Burica ∙ Panama
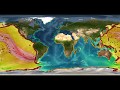 Quake/ Tsunami Historical Series: Chile - 1960 (Science On a Sphere)
 360º TIMELAPSE: What a dust storm looks like in Arizona
 M7.3 Japan Earthquake caught on stream (FULL VIDEO)