- Популярные видео
- Авто
- Видео-блоги
- ДТП, аварии
- Для маленьких
- Еда, напитки
- Животные
- Закон и право
- Знаменитости
- Игры
- Искусство
- Комедии
- Красота, мода
- Кулинария, рецепты
- Люди
- Мото
- Музыка
- Мультфильмы
- Наука, технологии
- Новости
- Образование
- Политика
- Праздники
- Приколы
- Природа
- Происшествия
- Путешествия
- Развлечения
- Ржач
- Семья
- Сериалы
- Спорт
- Стиль жизни
- ТВ передачи
- Танцы
- Технологии
- Товары
- Ужасы
- Фильмы
- Шоу-бизнес
- Юмор
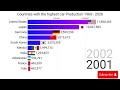
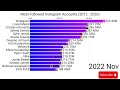
GDP Comparison: China Provinces vs India States (1960-2025) | Historical Data Visualization
How did the regional economic landscape of the world's two most populous nations change over six decades? This visualization tracks the GDP of every major Chinese province and Indian state from 1960 through 2025 projections.
The data for this video is derived from a comprehensive longitudinal dataset tracking 62 distinct sub-national regions. To ensure accuracy, the figures were calibrated against 2024 nominal USD benchmarks.
Historical Divergence: In 1960, many Indian states like Maharashtra and Uttar Pradesh were economically comparable to top Chinese provinces like Guangdong.
The China Boom: Following 1978 reforms, coastal Chinese provinces saw unprecedented CAGR, with Guangdong eventually surpassing the $1.9 Trillion mark by 2024.
India's Acceleration: Post-1991 liberalization, Indian states like Tamil Nadu and Karnataka show significant upward mobility, with Maharashtra projected to exceed $550 Billion by 2025.
New Formations: The data accounts for the formation of regions such as Telangana (2014) and Chongqing (1997), showing their growth from inception.
Timestamps
0:00 – 1960: Post-Independence India & Pre-Reform China
0:50 – 1978: The Start of China's Economic Opening
1:45 – 1991: India's Liberalization & The "Hindu Growth Rate" Shift
2:30 – 2001: China joins the WTO (Massive Growth Spike)
3:15 – 2014-2025: Modern Tech Hubs and Future Projections
#economy #gdpcomparison #indiavschina #datavisualization #racingbarchart #economics #maharashtra #guangdong #tamilnadu #jiangsu #indiagdpdata #chinagdp #AITestLab
Видео GDP Comparison: China Provinces vs India States (1960-2025) | Historical Data Visualization канала AITestLab
Комментарии отсутствуют
Информация о видео
2 мая 2026 г. 23:03:46
00:01:37
Другие видео канала