Support and Resistance Indicator
How to use a Support and Resistance Indicator to help determine if the price of Forex, stocks, futures or options will break through support.
Get my Free "RUBBER BAND TRADE:" http://www.topdogtrading.net/youtubeorganic-trading
This support and resistance trading strategy explained for zones, lines and levels in the markets when day trading and swing trading to help determine if those levels will hold the market if be broken by them.
Enjoy the video! Leave your questions and comments below!
Make sure not to miss a single video from Barry! Click here to Subscribe:
https://www.youtube.com/user/TopDogTrading?sub_confirmation=1
Watch the related video "How Much Do Day Traders Make" here: https://youtu.be/bU8kccEskT4
====================================================
Barry Burns
Top Dog Trading
TopDogTrading.com
Facebook: https://www.facebook.com/TopDogTrading/
Get the Free Trade Strategy: “The Rubber Band Trade”:
http://www.topdogtrading.net/youtubeorganic-trading
===================================================
---
Risk Disclosure: http://bit.ly/Risk-Disc
---
RISK DISCLAIMER:
The information contained on this video is for informational and educational purposes only. We are not registered as a securities broker-dealer or as investment advisers, either with the U.S. Securities and Exchange Commission or with any state securities regulatory authority. We are neither licensed nor qualified to provide investment advice. Trading and investing involves substantial risk. Financial loss, even above the amount invested, is possible. Seek the services of a competent professional person before investing or trading with money.
The information contained on this video, is not provided to any particular individual with a view toward their individual circumstances and nothing in this video should be construed as investment or trading advice. Each individual should assume that all information contained on this site is not trustworthy unless verified by their own independent research.
Any statements and/or examples of earnings or income, including hypothetical or simulated performance results, are solely for illustrative purposes and are not to be considered as average earnings. Prior successes and past performance with regards to earnings and income are not an indication of potential future success or performance.
You should never trade with money you cannot afford to lose. The information in this video is in no way a solicitation of any order to buy or sell. The author and publisher assume no responsibility for your trading results.
This information is provided "AS IS," without any implied or express warranty as to its performance or to the results that may be obtained by using the information.
Factual statements in this site are made as of the date the information was created and are subject to change without notice.
HYPOTHETICAL OR SIMULATED PERFORMANCE RESULTS HAVE CERTAIN INHERENT LIMITATIONS. UNLIKE AN ACTUAL PERFORMANCE RECORD, SIMULATED RESULTS DO NOT REPRESENT ACTUAL TRADING. ALSO, SINCE THE TRADES HAVE NOT ACTUALLY BEEN EXECUTED, THE RESULTS MAY HAVE UNDER- OR OVER-COMPENSATED FOR THE IMPACT, IF ANY, OF CERTAIN MARKET FACTORS, SUCH AS LACK OF LIQUIDITY. SIMULATED TRADING PROGRAMS IN GENERAL ARE ALSO SUBJECT TO THE FACT THAT THEY ARE DESIGNED WITH THE BENEFIT OF HINDSIGHT. NO REPRESENTATION IS BEING MADE THAT ANY ACCOUNT WILL OR IS LIKELY TO ACHIEVE PROFITS OR LOSSES SIMILAR TO THOSE SHOWN.
Видео Support and Resistance Indicator канала TopDogTrading
Показать
Комментарии отсутствуют
Информация о видео
Другие видео канала
 Trading MACD Histogram
 Do You Make These Support and Resistance Mistakes?
 Support and Resistance Zones that Work in Real Trading
 Make Money Day Trading
 Support and Resistance Cheatsheet (95% Of Traders Don't Know This)
 My Favorite Trading Method of the Last 10 Years | Barry Burns
 Support and Resistance Secrets: Powerful Strategies to Profit in Bull & Bear Markets
 3 PROFITABLE Support & Resistance STRATEGIES (Advanced Video...)
 Price Action Course
 Day Trading For A Living - How To Avoid Losing All Your Money
 How Much Do Day Traders Make
 How to Draw Support and Resistance in Forex. Walk-through Guide
 Bollinger Bands of the MACD Indicator, Part 3
 My Favorite Trading Method of the Last 10 Years | Barry Burns
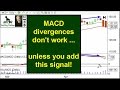 MACD Divergence Strategy
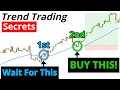 Trend Trading For Beginners - Forex, Stocks, and Crypto (I have never shared this before)
 I risked MACD Trading Strategy 100 TIMES Here’s What Happened...
 Forex RSI Indicator Strategy
 Best Trading Indicators for Day Trading and Swing Trading
 Multiple Time Frame Trading Methodology