Create live COVID dashboard using Power BI Dataflow - Power Query Dataflow - Business Intelligence
Detailed walk-through showing how to create a dashboard using Power BI Dataflows which is the online version of Power Query. Data refresh is automated. Learn how to create relevant and useful visuals including Ribbon Chart. This is an example of how business intelligence visuals can be created.
Data Source: https://raw.githubusercontent.com/CSSEGISandData/COVID-19/master/csse_covid_19_data/csse_covid_19_time_series/time_series_covid19_confirmed_global.csv
Dashboard link: https://app.powerbi.com/view?r=eyJrIjoiNmY2M2EwMmMtMGYyYy00ZDZlLWEzMzktZWE5YjE4MGYxMjI3IiwidCI6IjhmMWJiNTg3LTRmMDUtNDg3YS1hMjM4LTc3MTQ0MTI3ODRkOSIsImMiOjEwfQ%3D%3D
If you want to embed this into your own web page, use this Embed code...
Replace OBR with opening angled bracket and CBR with closing angled bracket.
OBR iframe CBR width="600" height="373.5" src="https://app.powerbi.com/view?r=eyJrIjoiNmY2M2EwMmMtMGYyYy00ZDZlLWEzMzktZWE5YjE4MGYxMjI3IiwidCI6IjhmMWJiNTg3LTRmMDUtNDg3YS1hMjM4LTc3MTQ0MTI3ODRkOSIsImMiOjEwfQ%3D%3D&pageName=ReportSection" frameborder="0" allowFullScreen="true"CBR OBR/iframeCBR
---------------------------------------------------------------------------------
Contents
=========================================
Intro - 00:00
Create Dataflow - 00:42
Set auto-refresh interval - 04:28
Import into Power BI Desktop - 05:02
Shape data - 05:33
Create first visual - country and cases - 06:37
Create Measures - 07:41
Time comparison chart - 11:43
Stacked bar chart - 13:48
Ribbon Chart - 14:18
Date Slicer - 16:24
Publish - 17:47
Share to Web - 18:39
Видео Create live COVID dashboard using Power BI Dataflow - Power Query Dataflow - Business Intelligence канала Efficiency 365 by Dr Nitin
Показать
Комментарии отсутствуют
Информация о видео
3 июня 2020 г. 23:08:28
00:19:20
Другие видео канала
 Corona Virus Dashboard on PowerBI | Using Live Data from Website | SHKExcelWorld
 Power BI Tutorial From Beginner to Pro ⚡ Desktop to Dashboard in 60 Minutes ⏰
 EVERYTHING you wanted to know about Power BI tooltips
 Power Query Overview - Automate Data Tasks in Excel & Power BI
 The How and Why of Power BI Aggregations
 Power BI Week Number (Weeknum) in Date Table #Q&A
 Power BI Parameters and Templates: Quickly Create New Power BI Models
 Developing in Power BI with Streaming Datasets and Real-time Dashboards
 Taking Buttons in Power BI Desktop to the Next Level
 Power BI Tutorial: 4 Ways To Get Data
 Making a Digital Dashboard! (w/ Google Calendar integration)
 7 Tips & Tricks for Stunning Power BI Reports!
![[Power BI] Como Calcular o Acumulado](https://i.ytimg.com/vi/ENOL_LggsbQ/default.jpg) [Power BI] Como Calcular o Acumulado
[Power BI] Como Calcular o Acumulado Advanced Power BI: Solving the Hard Problems
 Power BI Challenge 11 - COVID 19 Reporting
 Coronavirus(Covid-19) Data Analysis with Power Bi step by step(45 Min.)
 Power BI Dataflows 201 – Beyond The Basics
 Power BI Tips, Tricks & Hacks by Rui Romano
 DAX Fridays! #77: GROUPBY, CURRENTGROUP
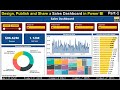 Design, Publish and Share a Sales Dashboard in Power BI (Part-1)